Download
1 / 65
660 likes | 849 Views
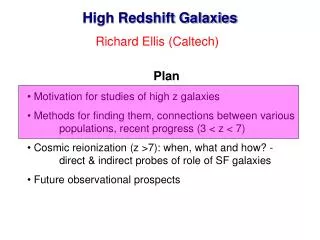
Star Formation in High Redshift Galaxies. Mauro Giavalisco Space Telescope Science Institute and the GOODS Team. Unattenuated Spectrum. Spectrum Attenuated by IGM. B 435 V 606 z 850. Finding high-redshift galaxies: color selection. B 435 V 606 i 775 z 850.

E N D
Star Formation in High Redshift Galaxies Mauro Giavalisco Space Telescope Science Institute and the GOODS Team
Unattenuated Spectrum Spectrum Attenuated by IGM B435 V606 z850 Finding high-redshift galaxies:colorselection B435V606i775z850 • Color selection is very efficient in finding galaxies with specific spectral types in a pre-assigned redshift range • Wide variety of methods available, targeting a range of redshifts, galaxies’ SEDs: • Lyman and Balmer break (Steidel, Adelberger, MG) • DRG (Franx, Labbe et al.) • BzK (Daddi et al.) • Photo-z (Mobasher et al) • Here, the case of • “Lyman-break galaxies” • GOODS yielded the deepest and largest quality samples of LBGs at z~4 to ~6 (7?) z~4
Colorselection at z>3B-band dropouts: 3.5<z<4.5 Vanzella et al. 2006
The Redshift Distribution #183 LBGs at z>3 are targets of the ongoing GOODS spectroscopic time with the ESO VLT and Keck Vanzella et al. 2006, 2005, 2006 in prep. Stern et al. 2006 in prep. #27
z~4 spectroscopy Variety of spectral “types” Very similar to the z~3 galaxies Emission of Lya observed together with weak interstellar absorption lines Stronger absorption lines are present when Lya is obsered in absorption Effect of geometry of ISM? Vanzella et al., in prep.
z~3 spectroscopy Popesso et al., Vanzella et al. in prep.
z~4 spectroscopy Popesso et al, in prep.
Exploring the geometry of the ISM Abs. Em. No obvious correlation of spectral “types” with UV color or ellipticity of the galaxies Whatever causes the absorption does not know about the geometry of the UV-luminous galaxy Outer ISM phase surrounding the UV-emitting regions whose spatial geometry DOES NOT correlate?
z~5 spectroscopy At z~5 and 6 selection effects make “emission” galaxies easier to confirm spectroscopically Vanzella et al. in prep.
Composite spectrum ofi-band dropouts The spectral properties of “observed” LBGs at z~6 are very similar to some LBGs observed at z~3. At z~6 it is very hard to obtain spectra of those LBGs with no Lya. Selection effect! Vanzella et al., Giavalisco et al 2006, in prep.
LBG luminosity function Relatively mild evolution of the UV luminosity function at 2.5<z<5.5 Giavalisco et al. 2006 in prep.
The history of the cosmic star formation activity: This plot spans 94% of the cosmic time! We find that at z~6 the cosmic star formation activity was nearly as vigorous as it was at its peak, between z~2 and z~3. a=-1.6 assumed Giavalisco et al. 2004 Giavalisco et al. 2006, in prep.
Star formation rates z~4 B-band dropouts Derive from far-UV continuum luminosity Dust obscuration correction: Calzetti starburst obscuration law Some rates are low, like z~0 spirals; other are prodigiously high But, does “corrected UV” trace SF well? Quite likely in these systems (Kennicutt et al., Calzetti et al 2006; also Dickinson’s talk)
The morphology of the LBGs • Smaller • Regulars, • Irregulars, • Merging, • Spheroids? • Disks? • No Hubble Seq. • No l-dependence Rest-UV lightRest-optical light Morphology does not depend much on wavelength: young systems Giavalisco et al. 1994, 1996, 1998 Steidel, Giavalisco, Dickinson & Adelberger 1996; Lowenthal et al. 1997; Dickinson 1998; Giavalisco 1998; Papovich, Giavalisco, Dickinson, Conselice & Ferguson 2003 Papovich, Dickinson, Giavalisco, Conselice & Ferguson 2004
Galaxies get smaller at high redshift… • First measures at these redshifts • Testing key tenets of the theory • Galaxies appear to grow hierarchically R~H(z)-2/3 Standard ruler R~H(z)-1 Ferguson et al. 2004
Surface Brightness Profile Analysis: - 2-D modelling using a single Sérsic function: Exponential disks: n = 1 R1/4 spheroids : n = 4 GALFIT • allows convolution by the point spread function • better handle on flux in the galaxy wings where S/N drops at low surface brightness levels • Measurement biases minimized Quality control: low chi2, small errors on parameters, mfit = mauto±0.5 [Ravindranath et al. 2006]
B-dropout with n ≥ 5 (centrally concentrated) 3" 3" 100 x 100 pixels
Profile Distribution of LBGs and z=1.2 starbursts (all M<0.5MUV*) LBGs at z > 2.5: ~ 40% exponential disks ~ 30% spheroid-like ~ 30% mergers, multiple cores Star - forming galaxies at z = 1.2: ~ 26% exponential disks ~16% spheroid-like ~ 58% mergers, irregulars? Similar conclusions from non-parametric study based on GINI, M20 and CAS coefficients Lotz, Madau, Giavalisco, Primack & Ferguson 2005
Probing the Intrinsic Shapes Through Ellipticity Distribution Observed peak in the = (1- b/a) , and skewed distribution Not only spheroids and circular disks seen at random orientations Intrinsically elongated galaxies Peak is lower at lower z
Possible explanations for the excess of “Elongated” morphologies among LBGs ! Rotation-dominated disks? Edge-on projections and selection effects Star forming clumps along gas-rich filaments of cold gas infall in DM halos High-z bars at early epochs of galaxy formation?
Star-formation in filaments of cold gas in DM halos? Ravindranath et al. 2006 35 kpc (180 comoving)
Hydro Simulation: ~Massive M=3x10¹¹ virial shock Kravtsov et al. Dekel & Birnboim 06 z=4 M=3x10¹¹ Tvir=1.2x10⁶ Rvir=34 kpc virial shock
Cold, dense filaments and clumps (50%)riding on dark-matter filaments and sub-halos Birnboim, Zinger, Dekel, Kravtsov
Observing the first gas-rich bars among LBGs at z > 2.5? Classic bar morphology in the first few billion years! Ravindranath et al. 2006 Bar in DGs encompasses the whole galaxy; ~2-3 kpc scalelength
More bar signatures among LBGs at z > 2.5 Spiral arms from bar ends?
More possible bars among LBGs at z > 2.5 Star formation at bar ends?
The mass of LBGs: spatial clustering • Galaxies at high redshifts have “strong” spatial clustering, i.e. they are more clustered than the z~0 halos “de-evolved back” at their redshift. • High-redshift galaxies are biased, I.e. they occupy only the most massive portion of the mass spectrum. • Today, the bias of the mix is b~1. • Idea is to test key tenets of the gravitational instability paradigm • evolution of galaxy clustering contains information on how the mass spectrum gets populated with galaxies as the cosmic time goes on. • Clustering of star-forming galaxies at a given redshift contains information on relationship between mass and star formation activity
The mass of LBGs: spatial clustering r0=3.3+/- 0.3 Mpc h-1 g = -1.8 +/- 0.15 Steidel et al. 2003 Adelberger et al. 1998 Giavalisco et al. 1998
Strong clustering, massive halos g=1.55 r0 =3.6 Mpc h-1 Porciani & Giavalisco 2002 Adelberger et al. 2004
Clustering strength depends on UV luminosity:mass drives LUV (SFR) GOODS Ground Lee et al. 2006 Adelberger et al. (2004) Giavalisco & Dickinson (2001)
Clustering segregation at z~4 and 5 Clustering segregation is detected in the GOODS ACS sample at z~4 Lee et al. 2006 See also Ouchi et al. 2004, 2006
Halos and Galaxies at z~3-5:Evidence of Evolution? Clustering scaling in good agreement with hierarchical theory Implied halo mass: >5x10¹⁰ MO(faint samples) >1012 MO (bright samples) 1-σ scatter between mass and SFR ~smaller that 100% LBG halos at z ~ 5 are less Massive. Specific star formation higher at higher redshift. Up-sizing! Giavalisco & Dickinson 2001 Porciani & Giavalisco 2002 Adelberger et al. 2004; Lee et al. 2006
Implications • Halo mass, I.e. local gravity, is a key parameter to control star fomation • Relationship between mass and star formation is tight • Possible to reconstruct the LUV(MH) distribution function (e.g. CLF) Giavalisco & Dickinson 2002; Lee et al. 2006 in prep.
Halo sub-structure at z~4 ACS depth made possible to observe structure within the halo. Break observed at ~10 arcsec Note: 10 arcsec at z~4 is about ~350 kpc, about the size of the virial radius for M~1012 Mo . Lee et al. 2006; see also Ouchi et al. 2006
HOD at z~5 Lee et al. 2006
The Halo Occupation Distribution at z~4 <Ng>=(M/M1)a M>Mmin Major improvement from COSMOS (Lee et al. PhD Thesis) Lee et al. 2006
Halos and Galaxies at z~4 Halo substructure: we observe an excess of faint galaxies around bright ones. massive halos contain more than one LBG “Bright Centers”: z_850<24.0 “Faint centers”: 24.0< z_850 <24.7 “Satellites”: z_850 >25.0 Substructure is observed with good S/N at faint luminosity L<L*/2 Lee et al. 2006
Conclusions • With large samples of high-z galaxies it is possible to test key ideas on star formation and galaxy evolution • LBGs at z>4 have mix of spectroscopic properties • Tracing geometry of ISM • Relatively high SFR; mild evolution of the UV lum. density at high z • Mix of UV morphology • Spheroid and disk-like systems observed • Higher fraction of irregular systems at z~1.5 than at z>3 • Intrinsic excess of elongated systems that disappear at lower redshifts • Evidence of cold accretion in filaments? • Large-scale bars? • Size evolution consistent with hierarchical growth • Detected halo sub-structure at z~4 (thanks to ACS sensitivity) • Proving key prediction of theory
Colorselection at z~2Distant Red Galaxies (DRGs):J-K>2.3 • UV-IR SEDs span range of Hubble sequence or dusty galaxies, (Forster-Schreiber et al.) • 50% detected with F(24mm)>60 mJy. SEDs consistent with either AGN or starbursts. • 24mm-detected DRGs are typically ULIRGs (LIR >1012 Lo) F(24mm) & z -> LIR using Chary & Elbaz 2001 templates X-ray detected GTO 24mm 50% completeness Papovich et al. 2005