Download
1 / 18
180 likes | 207 Views
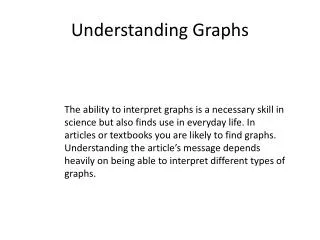
Learn how to interpret graphs by examining independent and dependent variables, understanding the relationships they reveal, and drawing meaningful conclusions.

E N D
Examine each graph carefully. What was tested, changed, or compared (INDEPENDENT VARIABLE) is plotted on the X-axis. The data that was observed & measured (DEPENDENT VARIABLE) is plotted on the Y-axis.
The title and the label on the X-axis tells us that the amount of fertilizer was tested in this experiment (Independent variable). • The Y-axis tells us that plant heightwas measured in centimeters in this experiment (Dependent variable).
Since there is a difference in the heights of the plants that received different fertilizers, we can say that there seems to be a relationship between plant height and type of fertilizer. • The independent variable (type of fertilizer) affected the dependent variable (plant height).
The title and the X-axis tells us that the types of degrees earned at colleges and universities between 1999 and 2000 were compared. • The Y-axis tells us the number of people earning these degrees was measured. Counting is a type of measurement.
There is a significant difference between the number of people graduating with business degrees and the number of people graduating with other types of degrees. • We can say that the type of degree (independent variable) affects the number of people that get that degree (dependent variable).
The title and the X-axis tells us that the independent variable (what was tested by the scientist) was time spent studying. • The Y-axis tells us that the dependent variable (what was measured by the scientist) was grades on a test.
We can see that the time spent studying increases along the X-axis. • We can see that tests grades increases along the Y-axis. • As time spent studying increases, so do tests grades. • There seems to be a relationship between time spent studying and test grades. • The more time spent studying, the higher the test grade.
The title and the X-axis tells us years were being compared (independent variable) by the scientist. When time is a variable, it is plotted on the X-axis. • The Y-axis tells us that the number of students [in millions] was measured by the scientist (dependent variable).
We can see that the time in years increases along the X-axis. • We can see that the number of students in millions increases along the Y-axis. • As time increases, so does the number of students. • There seems to be a relationship between time and the number of students. • The more time increases, the more students are enrolled in public schools.
The title and the X-axis tells us that the independent variable is the number of missed free throws per game. This is what was tested by the scientist. • The Y-axis tells us that the dependent variable is the number of wins. This is what was measured by the scientist.
We can see that the number of free throws increases along the X-axis. • We can see that the number of wins decreases along the Y-axis. • As the number missed free throws increases, the number of wins decreases.. • There seems to be a relationship between number of missed free throws and the number of games won. • The more free throws that are missed, the more games that are lost.