Download
1 / 39
410 likes | 576 Views
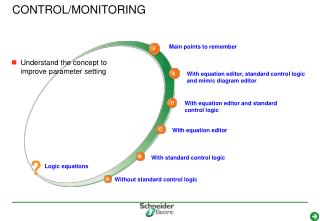
Control Performance Monitoring. Alf Isaksson, Alexander Horch ABB Corporate Research. PROST Seminar 22 January 200 2. Goal: detect and diagnose malfunctioning control loops. oscillation. or too high variance. Bad control manifests itself as. Methods needed to. detect oscillations

E N D
Control Performance Monitoring Alf Isaksson, Alexander Horch ABB Corporate Research PROST Seminar22 January 2002
oscillation or too high variance Bad control manifests itself as
Methods needed to • detect oscillations • diagnose oscillations • determine of variance is too large Since there are hundreds of loops methods should beautomatic
Oscillation detection • Hägglund (1995). Consider areas between zero crossings (count if large enough). • Stattin and Forsman (1998). Based on same idea, easier to use. • Seborg and Miao (1999). Damping ratio of auto-correlation function.
Oscillation index 0 = no oscillation, 1 = perfect osc. 0.88 0.25 Controller re-tuned
Valve IP converter replaced Oscillation index trend plot index days
1 0.8 0.6 0.4 0.2 0 0 0.2 0.4 0.6 0.8 1 Major advantage: correlation analysis Conclusion: The loops interact. One of them is likely to cause both oscillations oscillation loop 2 oscillation loop 1
F FC Potential causes are... cycling load static friction tight tuning
process output cross-correlation control signal If the cause is stiction...
cross correlation If the cause is NOT stiction... process output control signal
Stiction diagnosis • New method by Horch (1999) which utilizes that • when stictionin valve, process variable and control signal have odd cross-correlation • when”not stiction” the signals are such that the cross-correlation is even (due to negative feedback)
QC Q F FC Example: two coupled loops Stiction water pulp O.K.
Diagnosis: stiction no stiction Example cont’d concentration loop flow loop data cross-corr.
Important assumptions • O Self-regulating process Oscillation detected Cross-correlation method O.K. Integral action No compressible media
stiction Example II: integrating plant two different level control loops no stiction no stiction
CCF-method useless for integrating plants! Integration destroys the specific correlation in the stiction case. CCF is even, no matter if stiction or not. Re-calculation (differentiation) does not solve the problem level control loop
... ... ‘Second derivative is infinite’ Idea! Look for discontinuities in the data!
Y dy dt d2y dt2 stiction no stiction 1.) Differentiate the process output!
d2y d2y dt2 dt2 stiction 3a.) Histogram (ideally) no stiction
d2y d2y dt2 dt2 stiction 3b.) Histogram (noise & filter) no stiction
d2y dt2 Level control with stiction y(t) stiction MSE: 0.97 2.01
d2y dt2 Level control without stiction y(t) no stiction MSE: 1.17 0.46
Y dy dt Y’ d2y dt2 Use Camel method also for self-regulatingprocesses! Y stiction no stiction
Detect too large variance (too large 2-sigma) 2σ Basic problem: -2σ Is this good or bad?
Performance index • Introduce a control performance measure: • Possible to calculate denominator from normal operating data given knowledge of process time delay (deadtime). • Proposed by Harris (1989). • Modification presented in Horch and Isaksson (1999) Current variance Ip = Theoretically opt variance
Modified Index: Before: 2.11 1.07 After:
LoopMD ABB 'LATTS' KCL-CoPA LoopAnalyst Commercial tools / suppliers ... PROTUNER™
LATTS – Loop Auditing and Tuning Tool Suite • Process model identification • PID controller tuning • Loop auditing Part of ABB Industrial IT concept and uses the new Aspect Integrator Platform (AIP). Consists of three Aspects:
Auditing Aspect • Computes 21 different quantities/indices. For example: • Control error standard deviation • Oscillation index • Stiction diagnosis (correlation) • Stiction diagnosis (histogram) • Modified Harris index
Auditing Aspect cont’d • Combines these indices to test a number of hypotheses, such as • Acceptable performance • Possible valve problem • Sluggish tuning The result is summarized in a report, either as a text file or in Internet Explorer
Conclusions • Methods exist for non-invasive • Oscillation detection • Stiction diagnosis • Minimum variance benchmark • New ABB Product LATTS under Beta testing right now. Product release approximately June 2002.
Future work (industrial as well as academic) • detection and diagnosis of mill-wide oscillations • distinction of linearly and non-linearly caused oscillations • performance assessment based on full process model (event-triggered estimation) • application of multivariable performance index • performance monitoring of MPC loops