Download
1 / 16
160 likes | 179 Views
Learn how to estimate population means and proportions using simulations and random sampling methods. Analyze surveys, experiments, and observational studies to evaluate the validity of conclusions. Understand the importance of selecting unbiased samples for accurate representation.

E N D
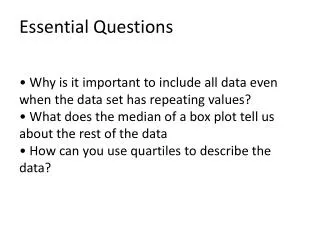
Essential Questions • How do we estimate population means and proportions and develop margin of error from simulations involving random sampling? • How do we analyze surveys, experiments, and observational studies to judge the validity of the conclusion?
When a survey is used to gather data, it is important to consider how the sample is selected for the survey. If the sampling method is biased, the survey will not accurately reflect the population. Most national polls that are reported in the news are conducted using careful sampling methods in order to minimize bias.
Other polls, such as those where people phone in to express their opinion, are not usually reliable as a reflection of the general population Remember that a random sample is one that involves chance. Six different types of samples are shown below.
Example 1: Classifying a Sample The campaign staff for a state politician wants to know how voters in the state feel about a number of issues. Classify each sample. a. They call every 50th person on a list of registered voters in the state. This is a systematic sample as members are chosen using a pattern. b. They randomly select 100 voters from each county to call. This is a stratified sample as the county is chosen and then voters are selected at random.
Example 1: Classifying a Sample continued c. They ask every person who comes to the next campaign rally to fill out a survey. This is a convenience sample as the people at the rally are easily accessible.
Example 2: Classifying a Sample The editor of a snowboarding magazine wants to know the readers’ favorite places to snowboard. The latest issue of the magazine included a survey, and 238 readers completed and returned the survey. Classify the sample. This is a self-selected example as readers volunteered to participate.
A probability sampleis a sample where every member of the population being sampled has a nonzero probability of being selected. Simple random samples, stratified samples, and cluster samples are all examples of probability sampling.
Example 3: Evaluating Sampling Methods A community organization has 56 teenage members, 103 adult members, and 31 senior members. The council wants to survey the members. Classify each sampling method. Which is most accurate? Which is least accurate? Explain your reasoning. Simple Random Systematic Stratified Not as accurate because more seniors have a chance to be heard Most accurate because every person has an equal chance of being heard Least accurate because not every person will be at the clean-up event.
Example 4: Evaluating Sampling Methods A small-town newspaper wants to report on public opinion about the new City Hall building. Classify each sampling method. Which is most accurate? Which is least accurate? Explain your reasoning. Self-selected Convenience Cluster Most accurate because different groups are randomly chosen and everyone in the group are surveyed Least accurate because only those who volunteer are chosen Not as accurate because only people who are in the cafeteria during lunch are chosen
The margin of error of a random sample defines an interval, centered on the sample percent, in which the population percent is most likely to lie.
Example 5: Interpreting a Margin of Error A city is about to hold an election. According to a survey of a random sample of city voters, 42% of the voters plan to vote for Poe and 58% of the voters plan to vote for Nagel. The survey’s margin of error is ±7%. Does the survey clearly project the outcome of the voting? Between 35% and 49% Between 51% and 65% Because the intervals do not overlap, the survey does clearly project the outcome of the voting.
Example 6: Interpreting a Margin of Error A survey of a random sample of voters shows that 38% of voters plan to vote for Gonzalez, 31% of voters plan to vote for Chang, and 31% plan to vote for Harris. The survey has a margin of error of ±3%. Does the survey clearly project the outcome of the voting? Explain. Between 35% and 41% Between 28% and 34% Yes; while there is overlap between the intervals for Chang and Harris, their intervals, which are from 28% to 34%, do not overlap the interval for Gonzalez, which is 35% to 41%.