Comparison of Text Messaging Frequency: In School vs. Out of School
This project investigates the frequency of text messaging during school versus non-school periods. The hypothesis posited that text messaging would be significantly higher when in school. Data collected over three weeks before and after Spring break (while in school) was compared to three weeks during Spring break (no school). Results indicated a marked increase in text messaging while at school. A box plot and line graph represent the average messages sent and received, supporting the hypothesis that students communicate more via text when in school.

Comparison of Text Messaging Frequency: In School vs. Out of School
E N D
Presentation Transcript
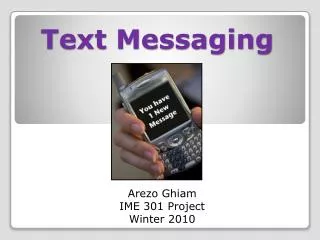
Text Messaging ArezoGhiam IME 301 Project Winter 2010
Issue: Amount of text messaging in school vs. not in school. • Hypothesis: I think that I use text messaging more when I am in school compared to when I am not. • Data Collection: I compared the number of text messages I send and received during the 3 weeks of Spring break (no school) to 3 weeks before and after Spring break, while I was in school.
Max=117 Max=119 Q3=93 Max=77 Q2=73 Q3=67 Q3=53 Q2=49 Q1=54 Q2=37 Q1=44 Q1=25 Min=24 Min=22 Min=9 Box Plot of Text Messages per Day
460 280 Average Messages Per Week
My hypothesis was correct. • Overall, I used text messaging much more when I was in school than when I wasn’t in school. Conclusion