1 / 1

Paul Hendrick, MPhty; et.al

keelie-peck
Download Presentation

Paul Hendrick, MPhty; et.al

An Image/Link below is provided (as is) to download presentation Download Policy: Content on the Website is provided to you AS IS for your information and personal use and may not be sold / licensed / shared on other websites without getting consent from its author. Content is provided to you AS IS for your information and personal use only. Download presentation by click this link. While downloading, if for some reason you are not able to download a presentation, the publisher may have deleted the file from their server. During download, if you can't get a presentation, the file might be deleted by the publisher.

E N D

Presentation Transcript


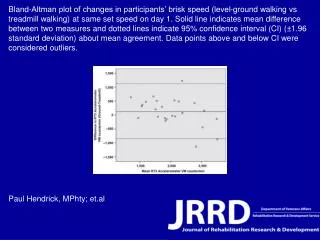
  1. Bland-Altman plot of changes in participants’ brisk speed (level-ground walking vs treadmill walking) at same set speed on day 1. Solid line indicates mean difference between two measures and dotted lines indicate 95% confidence interval (CI) (±1.96 standard deviation) about mean agreement. Data points above and below CI were considered outliers. Paul Hendrick, MPhty; et.al

More Related