Download
1 / 19
200 likes | 622 Views
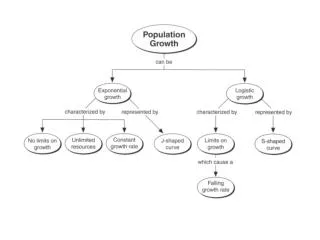
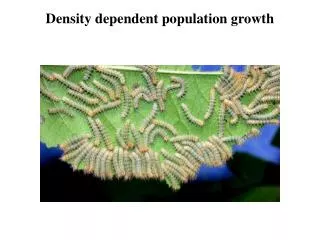
Deriving a model that expresses density-dependent limitations to growth. This is unchecked growth:. where r is a constant. In “checked” population growth, the factor multiplied with N can’t be a constant:. K. s. r max. N. The Logistic Growth Model. 2 parameters:

E N D
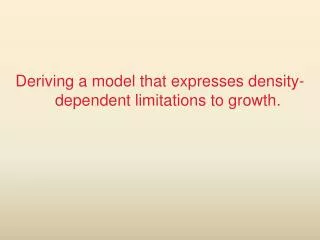
Deriving a model that expresses density-dependent limitations to growth.
This is unchecked growth: where r is a constant In “checked” population growth, the factor multiplied with N can’t be a constant:
K s rmax N
The Logistic Growth Model 2 parameters: rmax: the intrinsic (or maximal) per capita rate of growth K: the carrying capacity
Birth rates can decline with population size. Death rates can increase with population size. d or b bmax dmin N K
The Logistic Growth Model Pierre-François Verhulst Belgian mathematician (1804 – 1849)
Plug & Play • Excel Worksheets: • Logistic Growth
N K rmax t K K Three graphical representations of the Logistic Growth Model dN dt dN N dt N N absolute population growth rate vs. N relative population growth rate vs. N “Time series” or N vs. time
K dN dt • Identify on this graph all population sizes where the population growth rate is zero. • Identify the range of population sizes over which population size increases. • Identify the range of population sizes over which population size decreases. N
Growth rates are positive here. Population change in this direction: Growth rates are negative here. Population change in this direction: dN dt N K Zero Growth
Definition of an “equilibrium state”: The equilibium state of a population is the population size (N*) where the population neither increases nor decreases.
The Logistic Growth Model has two equilibria: N* = 0, also called the “trivial equilibrium”. N* = K is not trivial. A population of size K will neither decline of increase.
Definition of a “stable equilibrium state”: An equilibrium N* is said to be locally stable if population sizes that are slightly smaller or slightly bigger move back towards the equilibium.
Definition of a “stable equilibrium state”: An equilibrium N* is said to be globally stable if population sizes that have any other size than N* move towards the equilibium.
(equilibria) dN dt N K
This equilibrium is unstable! This equilibrium is globally stable! Growth rates are positive here. Population change in this direction: Growth rates are negative here. Population change in this direction: (equilibria) dN dt N K
The Logistic Growth Model has two equilibria: N* = 0, the “trivial equilibrium” is unstable! N* = K is globally stable! That means populations following the logistic growth model will always approach the carrying capacity K.
Summary: • The logistic model is the simplest model that expresses limits to population growth. • It assumes that the per capita population growth rate (dN/(Ndt)) declines linearly with population size N. • The logistic model has two parameters: • rmax is called the intrinsic rate of growth. It expresses the maximal growth rate a population can achieve when at low density. • K is called the carrying capacity. It expresses the stable population size where birth rates = death rates. • The logistic model has one non-trivial, globally stable equilibrium in K.