Download

1 / 24
240 likes | 323 Views
This document outlines new guidelines for suppressing small cell numbers in IBIS-Query output to ensure data privacy and reliability in public health informatics. It covers important concepts and methodology for decision rules and coefficients of variation. The guidelines provide minimum and strict criteria for reporting survey and population event data, with clear rules for data suppression based on CV thresholds and cell sizes.

E N D
New Guidelines for Data Result Suppression of Small Cell Numbers in IBIS-Query Output Public Health Informatics Brown Bag July 22, 2009 Kathryn Marti, Director Office of Public Health Assessment
Outline • Introduction • Background • Work Group • Important Concepts • Methodology • The Guidelines • Next steps
Introduction • Why not report data? • Protect privacy • Ensure reliable data • Why make data publicly available? • What reports? • Published reports • Online static tables • Web-based data query system output
Background • Current IBIS-Q suppression rules • Enhancements to IBIS-Q BRFSS • Increased likelihood of small cell sizes • Grew to department-wide effort • Develop UDOH-wide policy • HIPAA and more • Sensitivity for vulnerable populations
Data Suppression Decision Rules Work Group • Charter • Provide guidelines to UDOH programs • Program into IBIS-Q • Work Group Products: • Decision Rules • Decision Tree • Justification of the rules
Important Concepts • Confidence Interval • Coefficient of Variation • Power to detect a difference • Context/Use of the estimate
Coefficient of Variation CV=[100 x (SE(R)/R)]% • Where: • SE = the standard error of the estimate • R = the estimated rate • Unitless measure • Usually expressed as a percentage
Coefficient of Variation (cont’) • If the estimated percentage is greater than 50%, the CV is calculated by dividing the standard error of the estimate (SE(R)) by one minus the estimate (1-R). CV=[100 x (SE(R)/(1-R))]%
Coefficient of Variationfor Percentages Example #1 The crude estimated percentage of Utah adults aged 85 and older who were current cigarette smokers in 2007 was 7.65% with a standard error of 3.81%. CV = 100 x (0.0381/0.0765) = 49.8%
Coefficient of Variation for Percentages (cont’) Example #2 The crude estimated percentage of Utah adults aged 85 and older who were non-smokers in 2007 was 92.35% with a standard error of 3.81%. CV = 100 x (0.0381/(1-0.9235)) = 100 x (0.0381/0.0765) = 49.8%
Coefficient of Variation for Count Data D = # of deaths ~ Poisson P = # in population where deaths occurred R = rate per 100,000 = (D/P) *100,000 Var(R) = Var [(D/P) x 100,000] = (100,000/P)2 Var(D) = (100,000/P) x ((100,000*D)/P) = (100,000/P) x R CV = 100 x [SQRT(Var(R))]/R = 100 x [SQRT((100,000/P)*R)]/R = 100 x SQRT[100,000/(P*R)]
Coefficient of Variation for Count Data (cont’) Example #1 D = 388 Alzheimer’s disease deaths in Utah in 2006 P = UT Population in 2006 was 2,615,129 R = (388/2,615,129) x 100,000 = 14.84 per 100,000 CV = 100 x SQRT[100,000/(P*R)] CV = 100 x SQRT[100,000/(2,615,129 x 14.84)] = 5.08%
Coefficient of Variation for Count Data (cont’) Example #2 D = 5 Alzheimer’s disease deaths in Utah adults between the ages 55-64 in 2006 P = 55-64 UT Population in 2006 was 201,340 R = (5/201,340) x 100,000 = 2.48 per 100,000 CV = 100 x SQRT[100,000/(P*R)] CV = 100 x SQRT[100,000/(201,340 x 2.48)] = 44.75%
Methodology • Literature review • Compared suppression rules using BRFSS small area, low prevalence data. • < 5 observations in numerator or 30 in denominator • CV greater than 30% • CV greater than 50% • the CI length larger than the estimated percent • 1/2 the CI length >10% and denominator less than 50
Guidelines Minimum Criteria For Reporting Both Survey Data and Population Event Data: • ü CV < 50% • ü If 30% < CV < 50% an asterisk should be included with a footnote that says: *Use caution in interpreting, the estimate has a relative standard error greater than 30% and does not meet UDOH standards for reliability.
Guidelines Strict Criteria For Reporting Survey Data: • ü> 10 cases in the numerator • ü AND a CV < 30% For Reporting Population Event Data: • ü> 20 cases in the numerator and >100 persons in the population • AND a CV < 30%
<30% REPORT <50% CV=SE/RATE REPORT WITH WARNING 30<CV<50% SUPPRESS OR AGGREGATE GENERAL (MINIMUM CRITERIA) >50% RATE <30% REPORT REPORT WITH WARNING >50% CV=SE/(1-RATE) 30<CV<50% KIND OF POPULATION SURVEY DATA SUPPRESS OR AGGREGATE >50% REPORT <30% <50% CV=SE/RATE TYPE OF DATA SUPPRESS OR AGGREGATE >30% VULNERABLE (STRICT CRITERIA) ≥10 RATE COUNT DATA <30% REPORT NUMERATOR >50% CV=SE/(1-RATE) SUPPRESS OR AGGREGATE >30% SUPPRESS OR AGGREGATE <10
CV=100 x 100,000 . PR CV= 100 x 100,000 . PR ) ) √( √( <30% REPORT SURVEY DATA REPORT WITH WARNING GENERAL (MINIMUM CRITERIA) 30<CV<50% TYPE OF DATA SUPPRESS OR AGGREGATE >50% KIND OF POPULATION COUNT DATA <30% REPORT ≥20/100 VULNERABLE (STRICT CRITERIA) SUPPRESS OR AGGREGATE >30% CELL SIZE SUPPRESS OR AGGREGATE <20/100
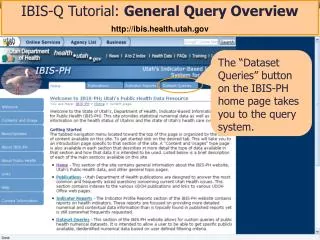
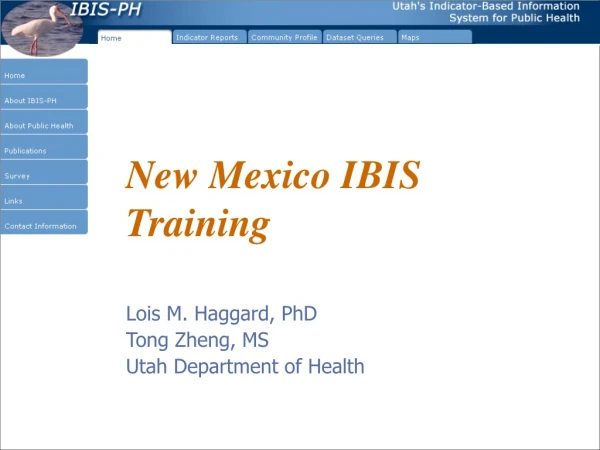
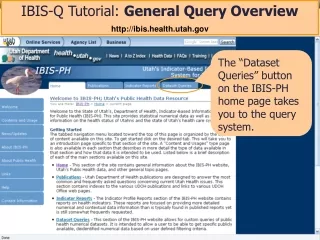
Next Steps • Program into IBIS-Q and SAS CGI • Determine how to display output and notes • New Mexico example • Utah Test server • Get OK from Data Stewards • Minimum criteria vs. Strict criteria
Next Steps (con’t) Suggested text for 30% < CV < 50% : • *Use caution in interpreting, the estimate has a relative standard error greater than 30% and does not meet UDOH standards for reliability.