Understanding Cognitive Modeling: Assessing Models and Making Comparisons
130 likes | 243 Views
This text delves into cognitive modeling, aiming to replicate how people perform tasks using equations. It discusses comparing model responses against human responses, data normalization, range of model responses, and model assessment criteria.

Understanding Cognitive Modeling: Assessing Models and Making Comparisons
E N D
Presentation Transcript
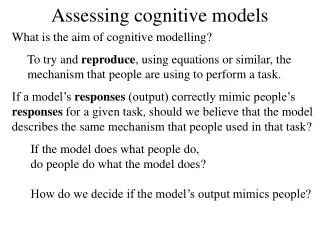
Assessing cognitive models What is the aim of cognitive modelling? To try and reproduce, using equations or similar, the mechanism that people are using to perform a task. If a model’s responses (output) correctly mimic people’s responses for a given task, should we believe that the model describes the same mechanism that people used in that task? If the model does what people do, do people do what the model does? How do we decide if the model’s output mimics people?
(another) toy model • To present the ideas here, I’ll make another toy model for the data. • In this model we score each test item as a member of each category by, • For each dimension • counting how many times the test item’s feature on that dimension occurs in the category in question • Multiplying that count by an ‘attention parameter’ for that dimension • Adding up those multiplied counts to get an overall score • For conjunctive categories like A&B, we just take the average scores from A and from B
How do we compare model’s responses against people’s responses? • Intuitive idea of agreement • ‘graphs’ are the same shape (whatever that means) • When people’s response is high, model’s response is high; when people’s is low, model’s is also low • A ‘scatterplot’ shows a straight line • BUT we must correct for scaling (model’s response usually falls on a different scale from people’s) • AND we should correct for different overall means For comparison,we NORMALISE
Normalising a set of data • Normalising a set of data means converting it so it has a standard mean (a standard average value across all the data) and (sort of) a standard range (really, a ‘standard standard deviation’). • We want the standard mean of 0: we transform our data so it has a mean of 0. • Subtract the true mean of the data from each data point; after that transformation, the new data has a mean of 0.
Getting the same range (standard deviation) • Standard deviation (SD) is like the average difference between each data value and the mean (the average) of all those data values. • It’s the average (the standard) deviation (difference) from the mean. • For mathematical reasons its usually computed as the root mean squared difference (from the mean). • To normalise we want a SD of 1. We transform our (already transformed) data by dividing each value by the data’s original SD. • This gives transformed data with SD=1.
Other things to consider when assessing a model (from Roberts & Pashler, 2000) Does the theory “fit too much”? If a theory has parameters that allow it to fit a very wide range of data (in particular, to fit data this is in some way the opposite of the data observed in an experiment), then the fact that the model fits experimental data is not great support for the model.
toy model range Range of model responses with different values of dimension parameters
The same data can be fit by a quite different theory In the toy model we used averaging for conjunctive categories. If we look at conjunctive classification scores only, then both average and sum will always give exactly the same correlation with observed data. Why? Because average = (sum / 2), and correlation normalises data so that division (or multiplication) by a constant is removed. If we look at correlation scores across both single and conjunctive categories, which performs better?
The theory fits the data, but makes a clearly incorrect prediction The average function predicts that an item’s classification score in a conjunction is always going to be between that item’s classification score in the constituents of that conjunction. This does not happen in our experimental data; to take some examples: Test item <XXB>, which has a lower score in A&B than in either A or B. Test item <YAC>, which has a higher score in A&C than in either A or C.
Consider the a priori likelihood of any model fitting the data “It is no success for Newtonian theory that stones, when dropped, fall towards the earth, no matter how often this is repeated… What really count are the confirmation of dramatic, unexpected, stunning, predictions” Lakatos (1978) We need to consider surprising predictions of our models; unexpected things that the model predicts. What if the model doesn’t predict any surprising things? Is that model worth very much? Does it tell us anything we didn’t know before?
How does the model fit individual subject responses (as opposed to average responses)? The average function predicts that a conjunctive classification score will always be between the two constituent classification scores. How many participants actually followed this pattern in their individual responses? (For this you need the individual-level data – you don’t need to consider this data for the experiment we’ve looked at!)
Your presentation • Explain your model • What choices did you make? Why? • Explain how you implemented your model. • Give enough detail so that others could duplicate your work • Report on the models performance • Assess the model (using the issues discussed here) • Send me the presentation for your model and the implementation of your model (spreadsheet, code etc), if you haven’t done so already.
Your report (due at the end of term) Around 1,000 to 1,500 words. You should Explain your model Explain its successes (in comparison with other models) Explain its failures (in comparison …) Draw your conclusions about the cognitive process being modelled. Be prepared to justify your conclusions – you should be convincing.