Download
1 / 16
160 likes | 306 Views
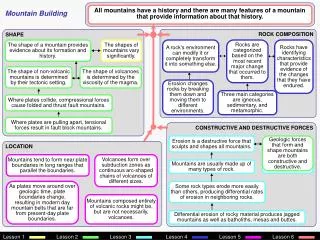
Lesson 19. 評価の指標. §B. ROC 曲線. 糖尿病. 非糖尿病. 高値. 血糖値. 感度= 25% 特異度= 90%. 低値. 糖尿病. 非糖尿病. 高値. 血糖値. 感度= 85% 特異度= 30%. 低値. 感度と特異度の関係. 感度を高くすれば特異度は低くなる。 特異度を高くすれば感度は低くなる。 感度と特異度は駆け引き trade-off の関係. カットオフ値. 陽性と陰性を区切る境界点の値 Cut-off point 最適な感度と特異度で決まる。. 糖尿病. 非糖尿病. 高値. 血糖値.

E N D
Lesson 19. 評価の指標 §B. ROC曲線
糖尿病 非糖尿病 高値 血糖値 感度=25% 特異度=90% 低値
糖尿病 非糖尿病 高値 血糖値 感度=85% 特異度=30% 低値
感度と特異度の関係 • 感度を高くすれば特異度は低くなる。 • 特異度を高くすれば感度は低くなる。 • 感度と特異度は駆け引き trade-off の関係
カットオフ値 • 陽性と陰性を区切る境界点の値 • Cut-off point • 最適な感度と特異度で決まる。
糖尿病 非糖尿病 高値 血糖値 感度=25% 特異度=90% 低値
糖尿病 非糖尿病 高値 血糖値 感度=85% 特異度=30% 低値
糖尿病 非糖尿病 高値 血糖値 感度=50% 特異度=70% 低値
偽陽性率 • False positive rate
ROC曲線ROC (Receiver Operating Characteristic) curve 100% 100% 0%
ROC曲線の判定-1 100% カットオフ 100% 0%
ROC曲線の判定-1 100% カットオフ 100% 0%
疾患なし(正常) 疾患あり(異常) 被験者の分布
ROC曲線と被験者の分布との関係 正常 異常 B A A B C C
異なる検査法の比較ROC曲線より 100% A B 100% 0%