Download
1 / 25
250 likes | 427 Views
Stratospheric NO y Studies with the SLIMCAT 3D CTM. Wuhu Feng , Stewart Davies, Jeff Evans and Martyn Chipperfield School of the Environment, University of Leeds, Leeds, UK. Studies of NO 3 Chemistry Comparison with balloon and aircraft NOy data

E N D
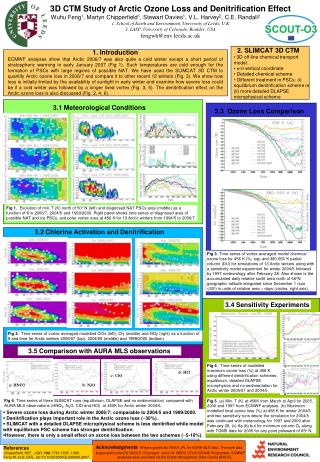
Stratospheric NOy Studies with the SLIMCAT 3D CTM Wuhu Feng, Stewart Davies, Jeff Evans and Martyn Chipperfield School of the Environment, University of Leeds, Leeds, UK • Studies of NO3 Chemistry • Comparison with balloon and aircraft NOy data • Improved Arctic 2002/03 Winter ozone loss • Coupled microphysical model (DLAPSE/SLIMCAT) • Long-term NO2 trends Acknowledgments Bhaswar Sen, Geoff Toon (NASA JPL) and all TOPOZ and VINTERSOL scientists
SLIMCAT 3D-CTM 3D Off-line Chemical Transport model • Horizontal winds and T from analyses (ECMWF, UKMO) • - vertical coordinate • Tracer Transport Default advection Scheme: Prather 2nd order moment scheme Vertical motion: CCM or MIDRAD radiation scheme • Detailed Chemical Scheme: 41 chemical species; 123 gas phase chemical reactions; 32 photolysis reactions ~9 heterogeneous reactions on liquid sulphate aerosols and solid PSCs http://www.env.leeds.ac.uk/slimcat Chipperfield M. P., JGR 104, 1781-1805, 1999
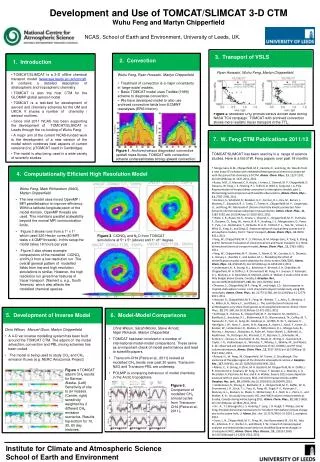
Stratospheric NO3 Chemistry NO3 has very simple chemistry in the stratosphere: NO2 + O3NO3 + O2 (1) NO3 + h NO2 + O NO3 + h NO + O2 NO3 + NO2 + M N2O5 + O2 (2) At night in the low-mid stratosphere NO3 can still be in steady state: [NO3] = k1[NO2][O3]/(k3[NO2][M]) = k1[O3]/(k3[M]) Nighttime [NO3] determined solely by O3 and T (no dependence on NOy!)
Testing of NO3 Chemistry from Balloon Observations SALOMON Balloon observations J.B. Renard et al (CNRS, Orleans) Nighttime (moonlight) observations of NO3, NO2 and O3. O3 21/1/2002 NO3 Model underestimates observed NO3, but steady-state a very good approximation 15-40 km. (Not a problem due to O3 which agrees well).
Comparison of 6 SALOMON flights with SLIMCAT NO3/O3 Model underestimates NO3 at high T k for O3 + NO2 Can derive best fit for k1: k1 = 6 x 10-13 exp(-2740/T) compared to JPL: k1 = 1.2 x 10⁻¹³ exp(-2450/T) ln(k) Renard et al., J. Atmos Chem (submitted)
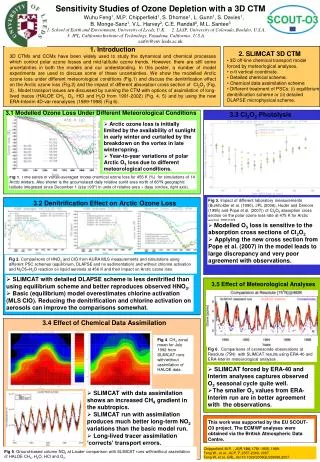
Polar Ozone loss • To quantify and understand the degree of chemical ozone loss in the Arctic stratosphere is an important issue But current models can’t give a satisfactory of the observed ozone loss based on the fact that models can not reproduce the observed ozone. • Transport problem (Different Cly and NOy in a given model lead to significant difference in chemical process). • Chemistry process • Radiative transfer process • Microphysics process • Complex interaction between theses processes
Ozone Hole • SLIMCAT reproduce the O3 column • Also show POAM PSC and MKIV location
MK IV Interferometer Measurements • Fourier Transform Infra-Red (FTIR) Spectrometer • By Jet Propulsion Laboratory in 1984 • Remote-sensing by solar absorption spectrometry • Provides stratosphere gases including NOy Trajectory of the MkIV payload from Esrange across Finland and into Russia on December 16, 2002 http://mark4sun.jpl.nasa.gov/
NOy-N2O Correlation Denitrification Renitrification • Model captures denitrification/renitrification signal well
NOy Partitioning • Model Captures major features of NOy species distribution • NO2 is poor in the lower stratosphere
ClONO2 and ClO The model overestimate ClONO2 due to underestimate the chlorine activation!
NOy Ratios • HNO3 and N2O5, ClONO3 overestimate, NO2 poor below 25Km
M55 Geophysica Aircraft http://www.knmi.nl/goa/workshopprogr.html
Comparison with Aircraft data (Cold region) • Different radiation transfer process result in different descent • Good simulation of NOy for the cold region (T< 195K)
Comparison with aircraft data (T>200K) SLIMCAT model overestimate denitrification due to equilibrium scheme
Comparison with O3 sondes SLIMCAT model (2.8 x 2.8) with CCM radiation scheme can successfully reproduce observed O3 in the polar region and midlatitude. Large O3 depletion occurred by the end of March.
Ozone loss • Different local ozone loss and polar ozone loss • CTM with MIDRAD radiation scheme lead to less O3 loss
Fully Coupled Microphysical Model for Denitrification A Lagrangian particle sedimentation model (DLAPSE, Carslaw, Mann et al.) has now been fully integrated with SLIMCAT code. Example 3D results for 19/12/2002 505K Modelled HNO3 decrease in good agreement with MIPAS (see EU MAPSCORE Project)
Studies of Long-term NO2 trend • Two runs: • 1989 – 2003. ECMWF (ERA40/operational) winds. 7.5o x 7.5o x 20 levels (0-60km). • (1) Time-dependent source gases (CFCs, CH3Br, CH4, N2O etc from WMO [2003]) • (2) As (1) but with fixed N2O after 1990.
3D CTM v Lauder NO2 Observations Run 311 – with observed surface N2O trend. Run 313 – As 311 but with constant surface N2O after 1990.
Observed (1/1981- 9/2003) + Modelled (1/1989-6/2003) Lauder Trends Trend model: linear trend, QBO, solar cycle, ENSO, offset annual cycle (K. Kreher, NIWA) Trend values in %/decade Model (with N2O trend) Model (without N2O trend) Obs. NOy, N2O should not show am/pm difference !
NO3 Chemistry • Night-time NO3 is independence on any other NOy species. The assumption of model steady state NO3 is good although model underestimates the observed NO3 • Comparison with MK4 Balloon and aircraft data: • Model Captures denitrification/renitrification signal and major features of NOy species distribution well, but poor NO2 simulation in the LS; SLIMCAT can simulate the observed low NOy well in the cold region, but overestimate denitrification at high T due to the equilibrium scheme • Improved Poalr Ozone loss Different radiation scheme result in different transport and ozone loss • High resolution simulation gives better NOy partitioning • Coupled microphysical model (DLAPSE/SLIMCAT) Successful denitrification compared with MIPAS • Long-term NO2 trend Model captures the observed increase NO2 trend,positive N2O give a negative NOy Conclusions
Future work • Rerun SLIMCAT model using chemical species from Reprobus CTM as initialisation. • Comparison with MIPAS data (NOy..) for 2002/03 winter. • Intercomparison with other CTMs.