Download
1 / 14
140 likes | 301 Views
The origin of stratospheric ozone in sensitivity studies with EMAC-FUB. S. Meul 1) , S. Oberländer 1) , A. Kerschbaumer 1) , U. Langematz 1) , V. Grewe 2) 1) FU Berlin 2) DLR, Oberpfaffenhofen. EGU – European Geosciences Union General Assembly 2011 Vienna. Motivation.

E N D
The origin of stratospheric ozone in sensitivity studies with EMAC-FUB S.Meul1), S. Oberländer1), A. Kerschbaumer1), U. Langematz1), V. Grewe2) 1) FU Berlin 2) DLR, Oberpfaffenhofen EGU – European Geosciences Union General Assembly 2011 Vienna
Motivation The ozone distribution is determined by local production, loss and transport Study of the ‚drivers‘ of future ozone changes in the stratosphere Analyses of the present-day chemical and dynamical mechanisms Information of the O3 origin offer a new approach for studying the transport patterns and the chemistry 2
Model setup • Chemistry-Climate Model ECHAM5/MESSyAtmospheric Chemistry (EMAC) (Jöckel et al., 2006): - version 1.7- horizontal resolution: 2.8°x2.8° (T42) - vertical resolution: 39 levels (model top: 0.01 hPa) - shortwave radiation parameterisation: FUBRad (EMAC-FUB) (Nissen et al., 2007) - prescribed sea-surface-temperatures (SSTs) and sea-ice- concentrations (SIC) (modelled, MPI-OM) - ozone origin diagnostic (Grewe, 2006) • Time-slice experiment (20 years) for the year 2000 (GHGs, ODSs, mean SSTs/SICs of the period 1995-2004, solar mean)
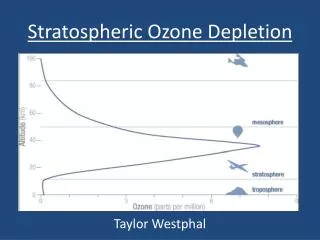
This diagnostic tool allows the identification of the ozone origin at each grid point in the atmosphere (at each timestep) Method: 1. Definition of n ozone production (= origin) regions in the model domain (n=19) Method: The ozone origin diagnostic (V. Grewe, 2006; Garny et al., 2011 (submitted)) 0.03 lower mesosphere (LM) 1 upper stratosphere (US) Pressure [hPa] 10 middle stratosphere (MS) Ozone production regions tropopause 1000 60°S 60°N 4
ozone is produced in region i marked with i (o3i) destroyed (destroyed ) transported Method: The ozone origin diagnostic (V. Grewe, 2006; Garny et al., 2011 (submitted)) This diagnostic tool allows the identification of the ozone origin at each grid point in the atmosphere (at each timestep) • Method: 2. Implementation of an ozone tracer o3i for each region i (i=1,n) production of o3i outside region i = 0 and
Method: The ozone origin diagnostic Contribution of the ozone origin tracer o3i to the full ozone field O3 January [%]
1. Part: Ozone budgets • tropical lower stratosphere • northern polar middle stratosphere 7
transport = tendency – (production – loss) net production Monthly ozone budget of the tropical lower stratosphere box-weighted mean • positive net production • negative transport → ‚export‘ • O3 increase Feb-Aug: net production > export • O3 decrease Oct-Jan: net production < export μmol mol-1 month-1 8
Monthly ozone budget of the northern polar middle stratosphere transport = tendency – net production box-weighted mean • negative net production • positive transport → ‚import‘ • O3 increase Sep-Mar: loss < import • O3 decrease Apr-Aug: loss > import μmol mol-1 month-1 9
2. Part: The origin of ozone • northern middle stratosphere • comparison of the polar middle stratosphere in the NH and SH 10
The origin of northern middle stratospheric ozone O3 (black) and o3i Mid-latitudes (20°-60°N) Polar Region (60°-90°N) locally produced ppmv Seasonal cycle of O3 as a combination of locally produced and ‚transported‘ ozone Seasonal cycle of O3 driven by the locally produced ozone 11
The origin of northern middle stratospheric ozone o3i /O3*100% Mid-latitudes (20°-60°N) Polar Region (60°-90°N) Sum of o3i minus locally produced O3 % July: (67%) NPUS (20%) NMMS (12%) January: NMMS (53%) NMUS (29%) (8%) July: (70%) NMUS (23%) NPMS (3%) January: (58%) NMUS (24%) TRMS (8%) 12
The origin of polar middle stratospheric ozone SH Polar Region (60°-90°S) NH Polar Region (60°-90°N) Ozone hole locally produced ppmv Jan Jul winter: larger abundance of upper stratospheric polar O3 in SH winter: - larger abundance of mid-lat originating O3 in the NH - larger abundance of stronger downward motion inside the vortex SH polar vortex edge less permeable for meridional O3 transport + weaker meridional circulation 13
Summary & Outlook - Analyses of the ozone budget and ozone origin in the present- day time-slice simulation with the CCM EMAC-FUB - Studies of future changes in ozone transport and chemistry by comparing different sensitivity experiments Future (2045) – Reference (2000)(annual mean) Thank you! ΔO3 in ppbv/decade 14