Download
1 / 7
70 likes | 307 Views
The Sustainable Growth Rate (SGR)—Medicare’s payment formula for physician services. Scheduled SGR cut in Medicare payments to physicians starting April 1, 2014. 10-year cost of repealing the SGR and preventing fee cuts; higher cost if fees are increased. Number of times Congress

E N D
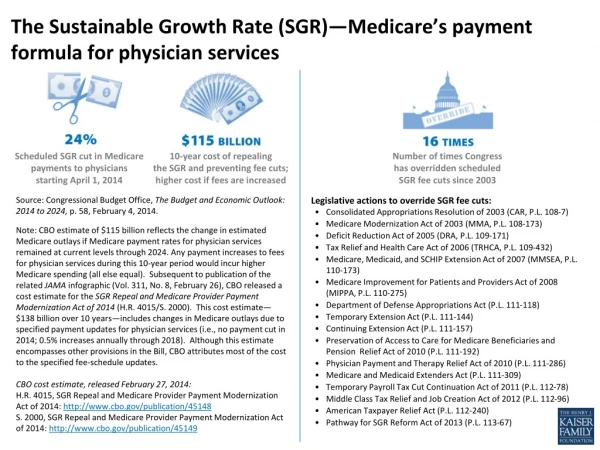
The Sustainable Growth Rate (SGR)—Medicare’s payment formula for physician services Scheduled SGR cut in Medicare payments to physicians starting April 1, 2014 10-year cost of repealing the SGR and preventing fee cuts; higher cost if fees are increased Number of times Congress has overridden scheduled SGR fee cuts since 2003 Legislative actions to override SGR fee cuts: • Consolidated Appropriations Resolution of 2003 (CAR, P.L. 108-7) • Medicare Modernization Act of 2003 (MMA, P.L. 108-173) • Deficit Reduction Act of 2005 (DRA, P.L. 109-171) • Tax Relief and Health Care Act of 2006 (TRHCA, P.L. 109-432) • Medicare, Medicaid, and SCHIP Extension Act of 2007 (MMSEA, P.L. 110-173) • Medicare Improvement for Patients and Providers Act of 2008 (MIPPA, P.L. 110-275) • Department of Defense Appropriations Act (P.L. 111-118) • Temporary Extension Act (P.L. 111-144) • Continuing Extension Act (P.L. 111-157) • Preservation of Access to Care for Medicare Beneficiaries and Pension Relief Act of 2010 (P.L. 111-192) • Physician Payment and Therapy Relief Act of 2010 (P.L. 111-286) • Medicare and Medicaid Extenders Act (P.L. 111-309) • Temporary Payroll Tax Cut Continuation Act of 2011 (P.L. 112-78) • Middle Class Tax Relief and Job Creation Act of 2012 (P.L. 112-96) • American Taxpayer Relief Act (P.L. 112-240) • Pathway for SGR Reform Act of 2013 (P.L. 113-67) Source: Congressional Budget Office, The Budget and Economic Outlook: 2014 to 2024, p. 58, February 4, 2014. Note: CBO estimate of $115 billion reflects the change in estimated Medicare outlays if Medicare payment rates for physician services remained at current levels through 2024. Any payment increases to fees for physician services during this 10-year period would incur higher Medicare spending (all else equal). Subsequent to publication of the related JAMAinfographic (Vol. 311, No. 8, February 26), CBO released a cost estimate for the SGR Repeal and Medicare Provider Payment Modernization Act of 2014 (H.R. 4015/S. 2000). This cost estimate—$138 billion over 10 years—includes changes in Medicare outlays due to specified payment updates for physician services (i.e., no payment cut in 2014; 0.5% increases annually through 2018). Although this estimate encompasses other provisions in the Bill, CBO attributes most of the cost to the specified fee-schedule updates. CBO cost estimate, released February 27, 2014: H.R. 4015, SGR Repeal and Medicare Provider Payment Modernization Act of 2014: http://www.cbo.gov/publication/45148 S. 2000, SGR Repeal and Medicare Provider Payment Modernization Act of 2014: http://www.cbo.gov/publication/45149
The majority of Medicare beneficiaries report having a usual source of care; typically a doctor’s office or doctor’s clinic Only 4% of Medicare beneficiaries do not have a usual source of care 96% of Medicare beneficiaries report having a usual source of care NOTES: “Other” setting of usual care includes: neighborhood or family health center, free standing surgery center, rural health clinic, company clinic, other clinic, walk-in urgent care center, at home, hospital emergency room, hospital outpatient, Veteran’s Administration, mental health center. Beneficiaries residing in facilities (such as nursing homes) are excluded from this analysis. Values do not sum to 100 due to rounding. SOURCE: Kaiser Family Foundation analysis of the 2011 Medicare Current Beneficiary Survey (MCBS) Access to Care File. For more information, see the Kaiser Family Foundation issue brief Medicare Patients’ Access to Physicians: A Synthesis of the Evidence, December 2013.
Most Medicare beneficiaries report that they can schedule timely appointments Routine Care Appointment (2012): In the last 6 months, how often could you get an appointment for routine care as soon as you needed? Traditional Medicare Medicare Advantage Plan Specialist Appointment (2012): In the last 6 months, how often was it easy to get appointments with specialists? Traditional Medicare Medicare Advantage Plan NOTE: Results are among respondents who reported experience scheduling the indicated appointment. SOURCE: Centers for Medicare and Medicaid Services (CMS), Consumer Assessment of Healthcare Providers and Systems (CAHPS) surveys, 2012. For more information, see the Kaiser Family Foundation issue brief Medicare Patients’ Access to Physicians: A Synthesis of the Evidence, December 2013.
MedPAC finds that most Medicare seniors do not seek a new physician, but a small share report problems finding one How much of a problem was it finding a new primary care physician/specialist who would treat you in the past year? Primary care physician Specialist Experience of seniors seeking a new primary care physician: Experience of seniors seeking a new specialist: No problem Small problem Did not seek a new primary care physician Did not seek a new specialist Big problem NOTES: Privately insured adults (age 50-64) report similar rates of problems, with no statistical differences compared to Medicare seniors (shown above). Values do not sum to 100 due to rounding. SOURCE: Medicare Payment Advisory Commission (MedPAC) Report to the Congress: Medicare Payment Policy, March 2013. For more information, see the Kaiser Family Foundation issue brief Medicare Patients’ Access to Physicians: A Synthesis of the Evidence, December 2013.
Seniors on Medicare report foregoing medical care at similar or lower rates than privately insured adults age 50-64 Percent of Medicare Seniors NOTES: *Statistically significantly different between Medicare and privately insured (at 95% confidence level). SOURCE: 1Kaiser Family Foundation, Cost and Access Challenges: A Comparison of Experiences Between Uninsured and Privately Insured Adults, Aged 55 to 64 with Seniors on Medicare, May 2012, basedon analysis of 2010 Health Tracking Household Survey; 2Medicare Payment Advisory Commission (MedPAC), Report to the Congress: Medicare Payment Policy, March 2013 (privately insured adults in MedPAC survey are age 50-64). For more information, see the Kaiser Family Foundation issue brief Medicare Patients’ Access to Physicians: A Synthesis of the Evidence, December 2013.
Most office-based physicians accept new Medicare patients; rates for Medicare are the same or better than private insurance Percentage of physicians accepting new patients, by patient insurance type, 2012 Patient insurance type NOTES: Pediatricians were excluded from Medicare and private non-capitated insurance categories. Physicians who did not respond to relevant survey questions were also excluded. The survey did not ask responding physicians to distinguish Medicare Advantage plans from traditional Medicare or other private insurance. Acceptance rates for patients with insurance status of self-pay or worker’s compensation are not shown. *Indicates difference from Medicare is statistically significant at the 95% confidence level. SOURCE: Kaiser Family Foundation analysis of National Ambulatory Medical Care Survey – National Electronic Health Records Survey, 2012. For more information, see the Kaiser Family Foundation issue brief Medicare Patients’ Access to Physicians: A Synthesis of the Evidence, December 2013.
Across all states, most physicians accept new Medicare patients 97% 83% NOTES: Pediatricians are excluded from this analysis. Physicians were not asked to distinguish between patients in traditional Medicare and Medicare Advantage plans. SOURCE: National Ambulatory Medical Care Survey – National Electronic Health Records Survey, 2012. For more information, see the Kaiser Family Foundation issue brief Medicare Patients’ Access to Physicians: A Synthesis of the Evidence, December 2013.


