Download

1 / 33
370 likes | 793 Views
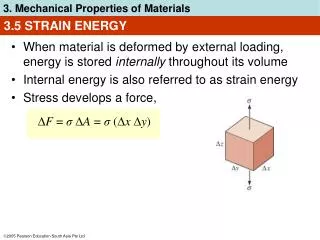
F = σ A = σ ( x y ). 3.5 STRAIN ENERGY. When material is deformed by external loading, energy is stored internally throughout its volume Internal energy is also referred to as strain energy Stress develops a force, . σ 2. ∆ U ∆ V. u =. =. σ 2 2 E. σ . σ 2. ( ).

E N D
F = σA = σ (x y) 3.5 STRAIN ENERGY • When material is deformed by external loading, energy is stored internally throughout its volume • Internal energy is also referred to as strain energy • Stress develops a force,
σ 2 ∆U ∆V u = = σ2 2E σ σ 2 ( ) u = = 3.5 STRAIN ENERGY • Strain-energy density is strain energy per unit volume of material • If material behavior is linear elastic, Hooke’s law applies,
σpl2 2E σplpl 2 ur = = 3.5 STRAIN ENERGY Modulus of resilience • When stress reaches proportional limit, strain-energy-energy density is called modulus of resilience • A material’s resilience represents its ability to absorb energy without any permanent damage
3.5 STRAIN ENERGY Modulus of toughness • Modulus of toughness ut, indicates the strain-energy density of material before it fractures • Shaded area under stress-strain diagram is the modulus of toughness • Used for designing members that may be accidentally overloaded • Higher ut is preferable as distortion is noticeable before failure
EXAMPLE 3.1 Tension test for a steel alloy results in the stress-strain diagram below. Calculate the modulus of elasticity and the yield strength based on a 0.2%.
345 MPa 0.0016 mm/mm E = = 215 GPa EXAMPLE 3.1 (SOLN) Modulus of elasticity Calculate the slope of initial straight-line portion of the graph. Use magnified curve and scale shown in light blue, line extends from O to A, with coordinates (0.0016 mm, 345 MPa)
EXAMPLE 3.1 (SOLN) Yield strength At 0.2% strain, extrapolate line (dashed) parallel to OA till it intersects stress-strain curve at A’ σYS = 469 MPa
EXAMPLE 3.1 (SOLN) Ultimate stress Defined at peak of graph, point B, σu = 745.2 MPa
EXAMPLE 3.1 (SOLN) Fracture stress When specimen strained to maximum of f = 0.23 mm/mm, fractures occur at C. Thus, σf = 621 MPa
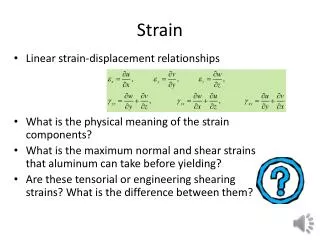
3.6 POISSON’S RATIO • When body subjected to axial tensile force, it elongates and contracts laterally • Similarly, it will contract and its sides expand laterally when subjected to an axial compressive force
lat long Poisson’s ratio, ν = − δ L long = δ’ r lat = 3.6 POISSON’S RATIO • Strains of the bar are: • Early 1800s, S.D. Poisson realized that within elastic range, ration of the two strains is a constant value, since both are proportional.
3.6 POISSON’S RATIO • ν is unique for homogenous and isotropic material • Why negative sign? Longitudinal elongation cause lateral contraction (-ve strain) and vice versa • Lateral strain is the same in all lateral (radial) directions • Poisson’s ratio is dimensionless,0 ≤ ν ≤ 0.5
EXAMPLE 3.4 Bar is made of A-36 steel and behaves elastically. Determine change in its length and change in dimensions of its cross section after load is applied.
P A σz = = 16.0(106) Pa σz Est z = = 80(10−6) mm/mm EXAMPLE 3.4 (SOLN) Normal stress in the bar is From tables, Est = 200 GPa, strain in z-direction is Axial elongation of the bar is, δz = zLz = [80(10−6)](1.5 m) = −25.6 μm/m
EXAMPLE 3.4 (SOLN) Using νst = 0.32, contraction strains in both x and y directions are x = y = −νstz = −0.32[80(10−6)] = −25.6 μm/m Thus changes in dimensions of cross-section are δx = xLx = −[25.6(10−6)](0.1 m) = −25.6 μm δy = yLy = −[25.6(10−6)](0.05 m) = −1.28 μm
3.6 SHEAR STRESS-STRAIN DIAGRAM • Use thin-tube specimens and subject it to torsional loading • Record measurements of applied torque and resulting angle of twist
3.6 SHEAR STRESS-STRAIN DIAGRAM • Material will exhibit linear-elastic behavior till its proportional limit, τpl • Strain-hardening continues till it reaches ultimate shear stress, τu • Material loses shear strength till it fractures, at stress of τf
τ = Gγ E 2(1 + ν) G = 3.6 SHEAR STRESS-STRAIN DIAGRAM • Hooke’s law for shear G is shear modulus of elasticity or modulus of rigidity • G can be measured as slope of line on τ-γ diagram, G = τpl/ γpl • The three material constants E, ν, and G is related by
EXAMPLE 3.5 Specimen of titanium alloy tested in torsion & shear stress-strain diagram shown below. Determine shear modulus G, proportional limit, and ultimate shear stress. Also, determine the maximum distance d that the top of the block shown, could be displaced horizontally if material behaves elastically when acted upon by V. Find magnitude of V necessary to cause this displacement.
360 MPa 0.008 rad G = = 45(103) MPa EXAMPLE 3.5 (SOLN) Shear modulus Obtained from the slope of the straight-line portion OA of the τ-γ diagram. Coordinates of A are (0.008 rad, 360 MPa)
EXAMPLE 3.5 (SOLN) Proportional limit By inspection, graph ceases to be linear at point A, thus, τpl= 360 MPa Ultimate stress From graph, τu= 504 MPa
d 50 mm tan (0.008 rad) ≈ 0.008 rad = V A V (75 mm)(100 mm) τavg = 360 MPa = V = 2700 kN EXAMPLE 3.5 (SOLN) Maximum elastic displacement and shear force By inspection, graph ceases to be linear at point A, thus, d = 0.4 mm
*3.7 FAILURE OF MATERIALS DUE TO CREEP & FATIGUE Creep • Occurs when material supports a load for very long period of time, and continues to deform until a sudden fracture or usefulness is impaired • Is only considered when metals and ceramics are used for structural members or mechanical parts subjected to high temperatures • Other materials (such as polymers & composites) are also affected by creep without influence of temperature
*3.7 FAILURE OF MATERIALS DUE TO CREEP & FATIGUE Creep • Stress and/or temperature significantly affects the rate of creep of a material • Creep strength represents the highest initial stress the material can withstand during given time without causing specified creep strain Simple method to determine creep strength • Test several specimens simultaneously • At constant temperature, but • Each specimen subjected to different axial stress
*3.7 FAILURE OF MATERIALS DUE TO CREEP & FATIGUE Creep Simple method to determine creep strength • Measure time taken to produce allowable strain or rupture strain for each specimen • Plot stress vs. strain • Creep strength inversely proportional to temperature and applied stresses
*3.7 FAILURE OF MATERIALS DUE TO CREEP & FATIGUE Fatigue • Defined as a metal subjected to repeated cycles of stress and strain, breaking down structurally, before fracturing • Needs to be accounted for in design of connecting rods (e.g. steam/gas turbine blades, connections/supports for bridges, railroad wheels/axles and parts subjected to cyclic loading) • Fatigue occurs at a stress lesser than the material’s yield stress
*3.7 FAILURE OF MATERIALS DUE TO CREEP & FATIGUE Fatigue • Also referred to as the endurance or fatigue limit Method to get value of fatigue • Subject series of specimens to specified stress and cycled to failure • Plot stress (S) against number of cycles-to-failure N(S-N diagram) on logarithmic scale
CHAPTER REVIEW • Tension test is the most important test for determining material strengths. Results of normal stress and normal strain can then be plotted. • Many engineering materials behave in a linear-elastic manner, where stress is proportional to strain, defined by Hooke’s law, σ = E. E is the modulus of elasticity, and is measured from slope of a stress-strain diagram • When material stressed beyond yield point, permanent deformation will occur.
CHAPTER REVIEW • Strain hardening causes further yielding of material with increasing stress • At ultimate stress, localized region on specimen begin to constrict, and starts “necking”. Fracture occurs. • Ductile materials exhibit both plastic and elastic behavior. Ductility specified by permanent elongation to failure or by the permanent reduction in cross-sectional area • Brittle materials exhibit little or no yielding before failure
CHAPTER REVIEW • Yield point for material can be increased by strain hardening, by applying load great enough to cause increase in stress causing yielding, then releasing the load. The larger stress produced becomes the new yield point for the material • Deformations of material under load causes strain energy to be stored. Strain energy per unit volume/strain energy density is equivalent to area under stress-strain curve.
CHAPTER REVIEW • The area up to the yield point of stress-strain diagram is referred to as the modulus of resilience • The entire area under the stress-strain diagram is referred to as the modulus of toughness • Poisson’s ratio (ν), a dimensionless property that measures the lateral strain to the longitudinal strain [0 ≤ ν≤ 0.5] • For shear stress vs. strain diagram: within elastic region, τ= Gγ, where G is the shearing modulus, found from the slope of the line within elastic region
CHAPTER REVIEW • G can also be obtained from the relationship ofG = E/[2(1+ ν)] • When materials are in service for long periods of time, creep and fatigue are important. • Creep is the time rate of deformation, which occurs at high stress and/or high temperature. Design the material not to exceed a predetermined stress called the creep strength
CHAPTER REVIEW • Fatigue occur when material undergoes a large number of cycles of loading. Will cause micro-cracks to occur and lead to brittle failure. • Stress in material must not exceed specified endurance or fatigue limit