Download
1 / 12
120 likes | 140 Views
This study examines the effectiveness of a television attack ad on changing the support level for a Congressional candidate, who currently has the support of only 44% of voters. A survey of 450 voters reveals that 186 support the candidate. The claim is tested at a 10% significance level and a confidence interval is constructed to confirm the conclusion.

E N D
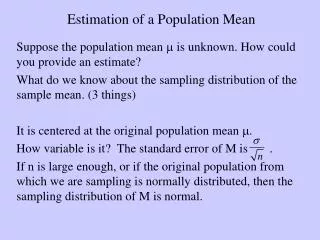
Do political “attack ads” work? A congressional candidate who currently has the support of only 44% of the voters runs a television spot that aggressively attacks the character of his opponent. To determine whether the advertisement changes his support level, his pollsters survey an SRS of 450 voters and find that 186 support the candidate. Test the claim at a 10% significance level. Construct an appropriate confidence interval to confirm your conclusion. Tests About a Population Mean Warmup
Section 9.3Tests About a Population Mean Learning Objectives After this section, you should be able to… • CHECK conditions for carrying out a test about a population mean. • CONDUCT a one-sample t test about a population mean. • CONSTRUCT a confidence interval to draw a conclusion for a two-sided test about a population mean. • PERFORM significance tests for paired data.
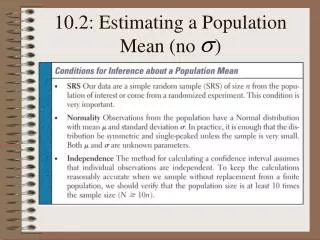
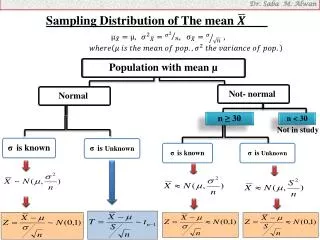
In an earlier example, a company claimed to have developed a new AAA battery that lasts longer than its regular AAA batteries. Based on years of experience, the company knows that its regular AAA batteries last for 30 hours of continuous use, on average. An SRS of 15 new batteries lasted an average of 33.9 hours with a standard deviation of 9.8 hours. Do these data give convincing evidence that the new batteries last longer on average? Tests About a Population Mean • Carrying Out a Significance Test for µ State the hypothesis and problems: . Check Conditions: Three conditions should be met before we perform inference for an unknown population mean: Random, Normal, and Independent. The Normal condition for means is Population distribution is Normal or sample size is large (n ≥ 30) We often don’t know whether the population distribution is Normal. But if the sample size is large (n ≥ 30), we can safely carry out a significance test (due to the central limit theorem). If the sample size is small, we should examine the sample data for any obvious departures from Normality, such as skewness and outliers.
Check Conditions: Three conditions should be met before we perform inference for an unknown population mean: Random, Normal, and Independent. Tests About a Population Mean • Carrying Out a Significance Test for µ • Random The company tests an SRS of 15 new AAA batteries. • Normal We don’t know if the population distribution of battery lifetimes for the company’s new AAA batteries is Normal. With such a small sample size (n = 15), we need to inspect the data for any departures from Normality. • The dotplot and boxplot show slight right-skewness but no outliers. The Normal probability plot is close to linear. We should be safe performing a test about the population mean lifetime µ. • Independent Since the batteries are being sampled without replacement, we need to check the 10% condition: there must be at least 10(15) = 150 new AAA batteries. This seems reasonable to believe.
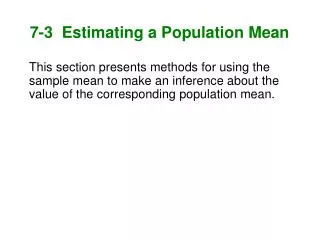
Calculations: Test statistic and P-value When performing a significance test, we do calculations assuming that the null hypothesis H0is true. The test statistic measures how far the sample result diverges from the parameter value specified by H0, in standardized units. As before, Test About a Population Mean • Carrying Out a Significance Test For a test of H0: µ = µ0, our statistic is the sample mean. Because the population standard deviation σ is usually unknown, we use the sample standard deviation sx. The resulting test statistic has the standard error of the sample mean in the denominator This statistic has a t distribution with n - 1 degrees of freedom. You will find a range for the p-value in the t-table.
Tests About a Population Mean • Carrying Out a Hypothesis Test The battery company wants to test H0: µ = 30 versus Ha: µ > 30 based on an SRS of 15 new AAA batteries with mean lifetime and standard deviation Interpret
Tests About a Population Mean • Using Table B Wisely • Table B gives a range of possible P-values for a significance. We can still draw a conclusion from the test in much the same way as if we had a single probability by comparing the range of possible P-values to our desired significance level. • Table B shows probabilities only for positive values of t. To find a P-value for a negative value of t, we use the symmetry of the t distributions.
Tests About a Population Mean Example: Student IQs Bon Air Elementary School has 300 students. The principal of the school thinks that the average IQ of students at Bon Air is higher than the national average of 100. To prove her point, she administers an IQ test to 30 randomly selected students. Among the sampled students, the average IQ is 108 with a standard deviation of 15. Based on these results, should the principal accept or reject her original hypothesis? Assume a significance level of 0.01
Tests About a Population Mean Example: Fuel Economy Suppose that an automobile manufacturer advertises that its new hybrid car has a mean gas mileage of 50 miles per gallon. A consumer’s group thinks that this claim is too high. They take a simple random sample of n = 30 hybrid vehicles and test their gas mileage. In this sample, the average is 47 miles per gallon with a standard deviation of 5.5 miles per gallon. Do we have enough evidence that the consumer group is correct at a 5% significance level?
For a test of H0: µ = µ0, our statistic is the sample mean. Test About a Population Mean • Significance Tests with known σ If the population standard deviation σ is known, we calculate the z-score for the test statistic We use the same procedure we learned with proportions to determine the p-value, based on the sign of the alternate hypothesis.
Tests About a Population Mean Example: Conductors Do male symphony conductors live longer, on average, than males in the general population? The mean life span for 35 male symphony conductors was 73.4 years, in contrast to the mean of 69.5 years for males in the general population. Assuming that the 35 conductors is a random sample, and that σ = 8.7 years, test the claim that the conductors have a longer average life span. Use a significance level of α = 0.05.
Tests About a Population Mean Example: Emissions The EPA reports that the exhaust emissions for a certain car model has a normal distribution with a mean of 1.45 grams of nitrous oxide per mile and a standard deviation of 0.4. The car manufacturer claims their new process reduces the mean level of exhaust emitted for this car model. A SRS of 28 cars is taken and the mean level of exhaust emitted for this sample is 1.21 grams. Perform a significance test with α = 0.01