Download

1 / 20
240 likes | 487 Views
Managing Heat for Reliability. Brian Piercy & David Chapman GSI Marketing & Apps Eng. Thermal Density Increasing. 25°C. 95°C. 1 BTU. 1 BTU. Equal thermal energy in a smaller volume results in higher temperature. Radiation Rate Decreasing. Older, larger parts had more surface area

E N D
Managing Heat for Reliability Brian Piercy & David Chapman GSI Marketing & Apps Eng.
Thermal Density Increasing 25°C 95°C 1 BTU 1 BTU Equal thermal energy in a smaller volume results in higher temperature.
Radiation Rate Decreasing Older, larger parts had more surface area and smaller Theta JA Newer, smaller parts have less surface area and larger Theta JA
Thermal Path to the Board is Getting Much Better Large Theta JB Smaller Theta JB
Hot Hosts Cook RAMs A nearby processor or FPGA makes thermal analysis based on Theta JA alone impossible.
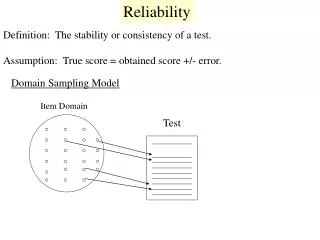
Theta JA Theta JA “The intent of θJA measurements is solely for a thermal performance comparison of one package to another in a standardized environment. This methodology is not meant to and will not predict the performance of a package in an application-specific environment.” JEDEC Standard JESD51-2A: Integrated Circuits Thermal Test Method Environmental Conditions - Natural Convection (Still Air) www.jedec.org/sites/default/files/docs/JESD51-2A.pdf
Thermal Power Circuit Ambient Temperature Case-to-Ambient Thermal Resistance Junction-to-Case Thermal Resistance PCB-to-Ambient Thermal Resistance RAM Power Junction-to-Board Thermal Resistance PCB Temperature PCB Thermal Resistance
3D Analysis is Required Thermal Design tools like Flowtherm™ account for all heat sources, thermal sinks and thermal resistances simultaneously. http://www.mentor.com/products/mechanical/products/flotherm
Predicting Die Temp • Complex analysis is required to predict the actual temperatures at various places in and around the RAM. • Approximate results can be obtained IF the RAM is physically connected to an object with high thermal mass via a path with low thermal resistance.
LR-HM Thermal Estimates Focus on a LOW RESISTANCE path to a HIGH MASS object.
Assume PC Board as Thermal Constant 30°C Air Tj = (Theta JB * Pd) + Tb Tj = (10°C/W * 1.5 W) + 50°C Tj = 65°C So… Tc = Tj - (Theta JC * Pd) Tc = 65°C – (2.5°C/W * 1.5W) Tc = 61.25°C So… Tj < 65°C. RAM will heat air and air will cool the RAM…some… 2.5°C/W JC 61.25°C Case Top 1.5 W Die 65°C Die 10°C/W JB 50°C Board
Assume Cold Plate and PCB as Thermal Constant Tj = Tc + (Theta JC * Pd) Tj = 20°C + (2.5°C/W * 1.5W) Tj = 23.75°C And… Tj = (Theta JB * Pd) + Tb Tj = (10°C/W * 1.5 W) + 50°C Tj = 65°C So… 65°C > RAM Tj > 23.75°C 20°C Cold Plate 2.5°C/W JC 20°C Case Top 1.5 W Die 10°C/W JB 50°C RAM Balls 50°C Board
Design vs. Characterization A single thermal resistance parameter cannot be used alone to predict die temperature. However… Theta JC (Junction to Case Temperature), Theta JB (Junction to Board Temperature), measured Case Temperature and measured Board Temperature can be used to estimate actual Junction temperature.
Thermal Characterization Data Sheet Thermal Characteristics JB = 12.3°C/W JC = 2.6°C/W Board to Junction Tj = (Theta JB * Pd) + Tb Tj = (12.3°C/W * 2.0W) + 30°C Tj =54.6°C Case to Junction Tj = (Theta JC * Pd) + Tc Tj = (2.6°C/W * 2.0W) + 50°C Tj =55.2°C So… Junction Temp 55°C* * Do not expect to get exactly the same answer for each method! Measured Case Temp = 50°C Measured Board Temp = 30°C MeasuredTotal Die Power = 2.0 W
Data Sheet Specifications • Absolute Maximum Ratings • Define the worst environment the device can tolerate for a short time. • Exposing a device to Absolute Maximum conditions reduces device lifetime. • Recommended Operating Conditions • The device is guaranteed to meet all specifications • A group will demonstrate a Failure Rate of no greater than 50 FITs for 10 years.
Under Recommended Operating Conditions… • Consume IDD Max or Less • Meet or exceed all DC Parametric Specifications • Input and Output Levels • Input and Output Impedances • Meet or exceed all Timing Specifications • Cycle as fast or faster than specified • Capture signals within tS – tH windows • Produce Output Data Valid at specified time • AND the population of devices will not exceed the forecast failure rate.
Reliability Useful Life • Burn-in forces “Infant Failures” • Qualification Testing verifies Random Failure Rate over “Useful Life” (normally 10 years) • Wear-out failures at “End of Useful Life” are normal. 50 FITS Or Less 10 Days 10 Years Drawing: http://en.wikipedia.org/wiki/File:Bathtub_curve.svg
Accelerating Failures • Typical Burn-In Example • Abs Max Voltage & Abs Max Temp applied for 128 hours. • HTOL* Reliability Test Example • Abs Max Voltage & Abs Max Temp applied to 315 devices for 1000 hours • 1 failure derates to 50 FITs over 10 Year Useful Life * High Temperature Operating Life Test
Summary A population of devices used within Thermal Recommended Operating Conditions and Electrical Recommended Operating Conditions will meet or exceed all specifications for 10 years while demonstrating a failure rate of no more than 50 Failures per 1 Billion Device Hours of operation (i.e. 50 FITs).