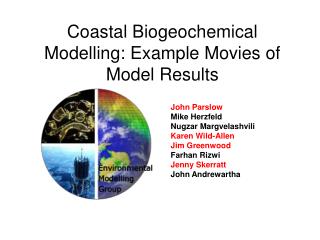
BVLD Airshed Modelling Results
350 likes | 501 Views
Join Stephanie Meyn, Air Quality Meteorologist from the Ministry of Environment, as she presents preliminary results on air quality modelling in the BVLD airshed. The session aims to enhance understanding of the complexities of modelling, the sources of uncertainty, and the potential for continuous improvement in air quality. Discover the significance of factors such as woodstove emissions, industrial points, and backyard burning, and how emerging research and modelling can aid in tackling air quality challenges.

BVLD Airshed Modelling Results
E N D
Presentation Transcript
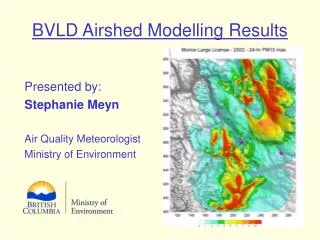
BVLD Airshed Modelling Results Presented by: Stephanie Meyn Air Quality Meteorologist Ministry of Environment
What I hope to accomplish tonight: • To give you an appreciation for the complexity of modelling, and sources of uncertainty. • To caution that these are preliminary results and are by no means what we are stuck with (much work can be done to improve accuracy). • To get you excited about the types of questions and scenarios you can explore with a model.
Purpose of the Modelling • Supports Goals outlined in Chapter 3. • Gain a better understanding of air quality and work towards continuous improve-ment in the Plan Area. • Reduce or eliminate air quality episodes through source-specific emission strategies. • Educational and operational changes to improve air quality. • Emerging research and changing regulations/policies.
What do Rubber Duckies have to do with Air Pollution Modelling? ?
Introduction to Modelling 14 years ago, a cargo container ship holding 29,000 rubber duckies was lost at sea in a North Pacific storm. They have since been found washed up on beaches along BC and Alaska, and have made their way through the Arctic and past Greenland. How can someone figure out where the rubber duckies will end up? Use A Model !!
Modelling Rubber Ducky Movement Curtis Ebbesmeyer of Seattle used the information about the location of the spill and the movements of the wind and ocean to model the movement of the Rubber Duckies. Using his model, he predicted that after 11 years, some were going to come ashore on the east coast of the U.S.
What information does an Air Pollution Model need? • Information about the pollution source (the duck launcher, how many ducks are launched at any given time). • Information about the atmosphere, 3-D winds, temperature, etc. (the ocean currents, winds, temperature, etc). • Information about the topography, mountains, valleys, etc. (islands and icebergs that get in the ducks’ way or change their movement)
Why Isn’t a Model Perfect? • We don’t have perfect equations to match the movement of the atmosphere (so we use averages). • We do a lot of averaging! (mostly to save time and keep our computers from frying). We usually work with information averaged over one hour. • Measurements used as inputs to the model may not be correct.
The Model Predicts: Average of possible final positions. (red dot) Launch at 0 hr Position after 1 hr Possible paths for a duck in turbulent waters over 1 hour Why Turbulence is Tricky If you launched a hundred duckies in a river race, a dispersion model would not accurately predict the winner or the location of a particular duck, but instead the average location of the duckies over a length of time.
Hazelton Smithers Telkwa Houston Burns Lake The BVLD Airshed
What was Modelled? • Re-creation of 2002 (Jan. thru Dec.) • All PM10 and PM2.5 emissions were quantified by Ben in his micro-emissions inventory. • These emissions were then launched into the atmosphere which was simulated using measured weather data and equations. • This pollution was then moved around in a 3-D simulation of the airshed using topographical and land use data.
Sources of Pollution that were Modelled Separately: • Woodstoves • Backyard burning and household waste burning • Industrial Permitted Point Sources (stacks) • Industrial Permitted Area Sources • Open Burning in different Forest Districts and Ventilation Index zones • Beehive Burners • Not yet complete: Road dust and open burning from sawmills.
How the Airshed was Modelled The Airshed was overlayed with a grid of ‘receptor’ points. Each little red dot represents a modelled point. The modelled points are spaced 2km apart. This means there are 9900 individual points. 220 km 180 km
How to Interpret the Pictures You’re About to See • Maximum 24-hour PM10 concentration possible at any given time in the year 2002 • This is not one day, or a summary for the year (multiple days). The model just picked the worst possible concentration that happened in that year at each of the individual grid points.
Industrial Area Sources Compressor Stations Mining Operations Boilers Cyclones Kilns
Open burning modelled by Timber Supply Area (Forest Districts)
Under-estimation of Open Burning • Model has not been well tested for this type of application. • Model has been tested for forest fires which have different characteristics. • Fire temperatures, structures, emissions, etc may not be captured properly. • Dispersion not happening at appropriate level in the atmosphere.
What if you want to know what’s happening at an individual point over time? 220 km 180 km
Determining Sources of Pollution in a Community Smoke from Woodstoves Smoke from Beehive Burners (note: in 2002 beehive burner was still operational) Modelled Area representing Smithers Smoke from Open Burning Plumes from Industries
Smithers PM10 Open burning under- estimated by model Road dust & burning
Questions/Scenarios • What if we turned off all of the emissions from beehive burners, woodstoves, burning, etc? • What if we switched to a new technology (e.g. all EPA-certified stoves)? • What if we managed burning in specific Forest Districts / TSAs under certain weather conditions?
What happens when Beehive Burner emissions are turned off? Preliminary Results: • In Smithers, reduction of 24-hr PM10 levels by up to 1 mg/m3 • In Houston, reduction of 24-hr PM10 levels by up to 1.25 mg/m3 • In Burns Lake, reduction of 24-hr PM10 levels by up to 1.5 mg/m3
What happens when all woodstove emissions are turned off? Preliminary Results: • In Smithers, reduction of 24-hr PM10 levels by up to 7.5 mg/m3 • In Houston, reduction of 24-hr PM10 levels by up to 5.5 mg/m3 • In Burns Lake, reduction of 24-hr PM10 levels by up to 3.6 mg/m3 So what would happen if we switched all stoves out to EPA-certified? Has not yet been modelled, but could easily be done.
Summary • Dispersion models are not perfect, but are a great tool for understanding behaviour of pollutants in an airshed. • Agreement between modelled and measured data indicates some under-estimation, particularly from open burning modelling. • Future work will address under-estimation. • This work can be used to answer important management questions, trade-offs, technological changes and other scenarios.
Recommendations • Create a suite of modelling indicators related to the Goals rather than just one. • Suggested additional indicators: • Degree of agreement between seasonal average monitoring and modelling estimates. • Number of scenarios utilized for management purposes.
Next Steps • Road dust and sawmill open burning modelling. • Thorough evaluation of open burning modelling. • More validation of modelled vs. measured data. • Comparison of atmospheric ventilation index conditions vs. modelled atmospheric conditions. • Scenario modelling guided by questions from the BVLD Airshed Management Society?