Download
1 / 10
100 likes | 116 Views
This text discusses the process of retrieving and analyzing sea ice and temperature datasets for the Beaufort Sea Polynya in 2006. It includes information on sources such as NSIDC, NOAA IMS, passive MW, NH EASE Grid, IABP, COADS, Polar Pathfinder Sampler, TOVS, KNMI climate explorer, NCEP/NCAR Reanalysis, and GHCN.

E N D
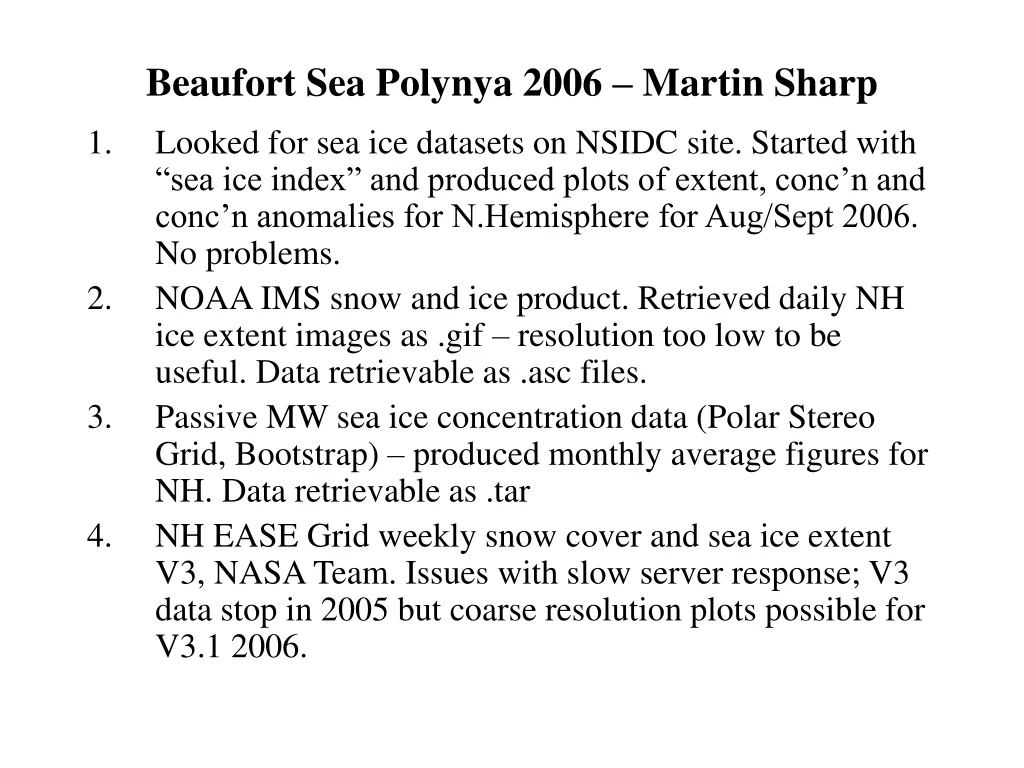
Beaufort Sea Polynya 2006 – Martin Sharp • Looked for sea ice datasets on NSIDC site. Started with “sea ice index” and produced plots of extent, conc’n and conc’n anomalies for N.Hemisphere for Aug/Sept 2006. No problems. • NOAA IMS snow and ice product. Retrieved daily NH ice extent images as .gif – resolution too low to be useful. Data retrievable as .asc files. • Passive MW sea ice concentration data (Polar Stereo Grid, Bootstrap) – produced monthly average figures for NH. Data retrievable as .tar • NH EASE Grid weekly snow cover and sea ice extent V3, NASA Team. Issues with slow server response; V3 data stop in 2005 but coarse resolution plots possible for V3.1 2006.
Beaufort Sea Polynya 2006 – Martin Sharp • Then went to look for surface T and atmospheric modelling results. Searched “Atmospheric” datasets for atmos temperature. Looked at IABP drifting buoy data, COADS, Polar Pathfinder Sampler and TOVS monthly NH datasets. None extended to fall 2006. • Gave up on NSIDC and went to KNMI climate explorer site. Was able to produce plots of monthly and summer mean 2m temperature fields using NCEP/NCAR Reanalysis data (surface T not available after 2004) as anomalies from 1979-2005 mean. • Then looked at observational datasets – tried COADS and MOHMAT but data coverage in Beaufort was poor; went to GHCN data and retrieved data for Barrow (no other site in region had 2006 data) – plotted up monthly means for Barrow as anomalies from 1979-2005 mean. • Took almost exactly 2 hours to achieve this
August 2006 Sept 2006 DMSP/SSMI monthly Sea Ice concentration – NASA Team
NCEP/NCAR Reanalysis
GHCN Data for Barrow – monthly means


