2007/2008 Emissions Modeling Platform Components and New Tools
390 likes | 582 Views
2007/2008 Emissions Modeling Platform Components and New Tools. Rich Mason, Alison Eyth , Alexis Zubrow U.S. EPA OAQPS mason.rich@epa.gov Zac Adelman Institute for the Environment, UNC-CH 2012 Region 4 Regulatory Modelers Workshop November 15, 2012. Emissions Modeling Platform.

2007/2008 Emissions Modeling Platform Components and New Tools
E N D
Presentation Transcript
2007/2008 Emissions Modeling Platform Components and New Tools Rich Mason, Alison Eyth, Alexis Zubrow U.S. EPA OAQPS mason.rich@epa.gov Zac Adelman Institute for the Environment, UNC-CH 2012 Region 4 Regulatory Modelers Workshop November 15, 2012
Emissions Modeling Platform • “Platform” means the data and processing methods used to produce emissions inputs for AQ models • EPA has worked to improve both data and methods for its version 5 (v5) emissions modeling platform • The 2008 NEI v2 is the basis of the v5 platform • Version 2 includes improved HAPs, lat-lon locations, control device information, and other updates such as RWC, railyards, MOVES, oil & gas • Both 2007 and 2008 versions of the platform are needed • The choice of year is based on the purpose of the study and the ambient air quality concentrations for the issue of interest • 2008 NEI stationary nonEGUs + nonpoint are used as the “starting point” for both years for most source categories
2008 NEI v2 • Provides “starting point” emissions used in the platform • Earlier versions of the NEI were vetted through emissions and AQ modeling • Emissions are less than 2005 NEI for most pollutants • New web interface provides data access and summaries • 2008 NEI first to use the Emission Inventory System (EIS) • supports merging data from various sources (e.g. state, local, EPA) • improves transfer of data between inventories and emissions modelers • provides greater transparency of data sources • has an underlying relational database • includes a sophisticated reporting system • exports inventories into new SMOKE inventory format “FF10”
Upcoming Applications of 2007/2008 Platforms • PM NAAQS Final: ongoing • 2020 Base Case w/ National Rules • include all current rules (CSAPR, MATS, Boiler MACT reconsideration, RICE, ULSD, RFS2/LDGHG Phase 1, HDGHG) • Anti-backsliding Final Rule: this winter • NAPA 2008: possibly 2013 • Direct full HAP/CAP use of most elements of 2008v3 NEI • CDC2009 & CDC2010: ongoing • Ozone NAAQS REA: ongoing • CMAQv5.0 evaluation
2007 Year-Specific Data • Year-specific CEM data for EGUs • 2007 meteorology and VMT • NONROAD model outputs • Onroad emission factors from MOVES • Class 3 CMV ECA-IMO projected from 2002 • Biogenics • Select RPO source categories: • some RWC and open burning • fugitive dust • monthly ag NH3 • c1c2 CMV and rail • CARB onroad, nonroad and c1c2 CMV and rail
Non-NEI Emissions Components RPO and CARB inventories Older versions of state-submitted data EPA default data where appropriate Biogenics BEIS 3.14 for 2007, 2008 Canada: 2006 Inventory Mexico: projected 2008 from 1999 Commercial Marine Class 3 Nonroad Area fugitive dust updated with land-use and meteorological adjustments
Emissions Components of the Initial 2007 Evaluation & Regulatory Platforms Initial 2007 Platform* 2008 NEI v2 EGU 2008 NEI v2 fires 2008 SMOKE-MOVES onroad 2008 NEI v2 nonroad 2008 NEI v2 nonEGU Point 2008 NEI v2 Nonpoint 2007 California onroad, nonroad and loco-marine 2007 EGUs/CEMS 2007 Fires/avefire 2007 RPO (MARAMA, SESARM, MWRPO) select sources (e.g., RWC, c1c2rail, ag, dust, open burning) 2008 NEI v2 Alternative Data 2007 SMOKE-MOVES w/ refueling separate 2007 nonroad (not incl. CA) 2006 CAN & 2008 MEX 2006 WRAP Oil & Gas Phase III *Individual modeling projects may have a different mix of data, depending on the needs of the project
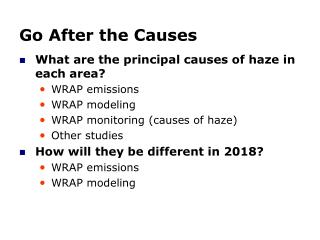
Alternative Inventories: Oil & Gas • WRAP Phase III • 2006 base year for select basins in CO, NM, UT, WY and MT • detailed inventories based on survey data • includes drilling equipment, extraction and numerous other processes • Basin-specific spatial allocation and speciation • 2008, 2012 and 2015 estimates recently received but not yet evaluated/implemented • Barnett Shale (NE TX) Phase II year 2009 via TCEQ ongoing: • http://www.tceq.texas.gov/airquality/point‐source‐ei/psei.html#barnett • Other basins also ongoing and not currently used: • Marcellus Shale inventories in northeast • Permian (SE NM and west TX) year 2008 from WestJump (WRAP) project
Alternative Inventories: Oil & Gas VOC oil and gas difference WRAP Phase III minus NEI 2008 does not reflect SW WY basin (new): double NOX and 56% more VOC
New Methods: SMOKE-MOVES MOVES: • “Motor Vehicle Emissions Simulator” , replaces MOBILE6 Historically: • Run MOVES (previously MOBILE6) in inventory mode • Produce state estimates to create monthly inventories, allocate to counties via NMIM estimates • Process inventories through SMOKE as month-specific area/nonpoint sources Motivation for SMOKE-MOVES: • More closely integrate MOVES into the emissions modeling process • Having the activity data has been very useful, emissions no longer “black box” • Emission factors for multiple pollutants are sensitive to temperature • PM, VOC, NOX, etc. • Want to include more temporally/spatially resolved temperatures • Computational considerations • Keep computation demands “reasonable” • Representative counties reduce the number of runs needed • Use lookup tables for emission factors
New Methods: SMOKE-MOVES Driver Script MeteorologicalPreprocessor(Met4Moves) MOVES Post-processingScript SMOKE AQ model-ready files
New Methods: SMOKE-MOVES Emissions respond to day-specific temperature variations
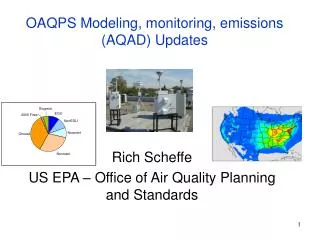
New Methods:Residential Wood Combustion • Developed meteorology-based temporal allocation methods for RWC • New SMOKE preprocessor (GenTPRO) creates daily temporal allocation factors • generates a temporal cross-reference file • uses regression equation relating ambient PM2.5 and temperatures • T threshold of 50 F: if ambient T > 50, emissions = 0 • T threshold user-defined by FIPS –next version SMOKE. We changed T threshold to 60 in southern states • SMOKE applies day-specific temporal profiles to create daily emissions
New Methods: RWC RWC 2008 NEIv2: “old method” – “new method @50F” Jan 1 Jan 2
RPOvs NEI RWC Data Analysis PM2.5 Outdoor Hydronic Heaters NEI (top left) RPO (bottom left) Difference RPO – NEI (above)
New Methods:animal ag NH3 • ag NH3 from animals (CAFO) • GenTPRO uses Russell and Cass equation which relates emissions to temperatures and wind speed • Create hour-of-month temporal profiles • - previous annual to monthly allocation is retained MN animal ag NH3 daily temporalization
New Methods:fires • SMARTFIRE 2.0 • Integrate satellite fire detects with ground-based databases • Classifies fires as: • wildfires • prescribed • wildland fire use (WFU) • agriculture • unclassified • v2.0 improvements: • fire sizing algorithms • Classified all “unclassified” fires • Improving evaluation of cloud-cover interference • 2008 and 2009 inventories SMARTFIRE v2.0 • previous years SMARTFIRE v1.0 • NEW: developed 2007 (draft) and 2010 using v2
New Methods:ag fires • ag fires based on SMARTFIRE v1.0 • NEI team applied EF and crop harvesting patterns • 2008 daily emissions aggregated to monthly nonpoint inventory for 2007 to minimize year-specific met-dependence April July PM2.5
New Methods:average fires • Fire Averaging Tool (FAT) • Processes point daily fires to produce emissions at daily/county resolution • Purpose is for regulatory runs for base and future year • Leverages point daily fires • User controls: • range of years • grouping of SCCs • averaging period – FAT uses a rolling average (e.g., 1 week) • We currently use 2008 (SF2) for Rx burning & 2003-2009 for wildfires
New Methods:afdust met adjustment * paved roads inventory does not match met-adjusted NEI • Includes PM emissions from paved* and unpaved road dust, agricultural tilling, construction, etc. • New adjustments developed by EPA ORD • Transport fraction • Reduces PM based on land use via BELD3 • Meteorological adjustment • Snow and rain suppresses PM emissions • Snow on the ground OR top 1cm layer of soil >= 50 % saturated -> afdust emissions = 0
New Methods:afdust met adjustment Jan transport fraction adj. Jan unadjusted PM2.5 Jan transport fraction and met adj.
Ancillary Data:Spatial Surrogates • Allocate nonpoint and mobile sources to grid cells • Census 2010 based surrogates • circa-2000 for old surrogates • FEMA HAZUS (circa 2010) based surrogates • e.g. Industrial Land, Commercial + Industrial • National Transportation Atlas Database (NTAD) 2011 based surrogates • Other updates developed but not yet implemented • National Land Cover Database (crop and pasture land, residential density) • Gas stations, TIGER-Line data (e.g. roads), etc. • WRAP Phase III Oil & Gas: basin specific spatial surrogates
Ancillary Data:Speciation • Speciation profiles are used to map inventory pollutants to AQ model species • PM AE6 speciation • support for CMAQ v5.0 • includes more specific speciation of PM (e.g. Al, Mg, etc.) • Onroad speciation • updated profiles from OTAQ for VOC • permeation mode specific profiles for VOC • WRAP Phase III Oil & Gas • basin-specific VOC profiles • SPECIATE 4.3 • process underway to systematically review new profiles
Projections • Goal is to incorporate all “on the books” regulations • work with RPOs and states to identify these controls • Updated non-EGU projections, controls and closures based on 2007/2008 platform • Reviewed consent decrees • Includes upstream impacts from EISA/RFS2 • Updates to methodology for several sources • RWC, ag NH3, ULSD, RICE, Boiler MACT • Oil & Gas projections mostly unavailable outside of WRAP basins • Updated projection tools for FF10 and for monthly controls • Later: Evaluate alternative methods for projecting select non-EGU industrial source categories based on AEO data
SMOKE updates • SMOKE-MOVES • improved speed & temperatures out of range of EF • support for: MOVES2010b, refueling and for more HAPS • Support for new inventory format: Flat File 10 (FF10) • monthly, daily, and hourly emissions and controls for point and nonpoint • monthly activity data (e.g. VMT) • EIS can produce the FF10 files • New temporal profiles: GenTPro • Support for monthly profiles • Support for daily and hourly MET-derived profiles • SMOKE v3.1 currently available, v3.1 updates include: • movesmrg optimization/bug fixes: • option fast/slow for high/low memory • use correct reference month lookup table for last few local hours each month • apply control factor by FIPS/SCC/pollutant/mode/month • met4moves allow TEMP_BUFFER_BIN to cover wider temperature ranges in MOVES lookup tables • fixes/enhancements of FF10 daily/hourly inventory files, allow processing w/ other PTDAY/PTHOUR inventories
Next Steps • Continue to include 2007 model platform improvements • CMAQ v5 testing (lightning NOX, ag NH3 bidirectional flux) • oil and gas Permian basin 2008 data • CEMs clean-up • RWC improvement via 2011 NEI project • C3 marine reconciliation • Latest spatial surrogates (e.g., crops, gas stations, dry cleaners) • inventory controls QA and validation • MEGAN v2.10 biogenics • 2007-2010 SF2 fires • Future year projections • updated consent decrees/settlements • available SIP control measures • Local RWC controls/burn bans • oil and gas WRAP basin projections to 2010, 2012 or 2015 • Begin construction of 2017/2030 base cases for ABS FRM • RPO inventory projections
Acknowledgments UNC-Institute for the Environment ENVIRON CSC ERG RPOs and EPA regions CARB EPA’s: OTAQ, ORD, AQM group, NEI team
Why 2007? • Factors considered in choosing base year • Availability of year-specific emissions data • Ability to use recent ambient data in design value projections • Avoid years that are not conducive/representative regarding the formation of ozone and PM2.5 concentrations • 2007 was selected because….. • We can utilize/leverage the 2008 NEI • 2007 AQ-related meteorology was more representative of average conditions than 2008 (2008 had generally “unconducive” met in most of the US) • We can use 2005 thru 2009 ambient data as the starting point for future projections
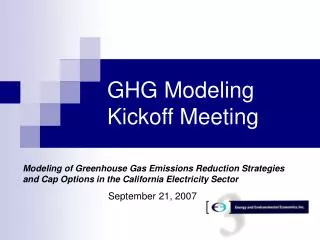
Representativeness of Air Quality in 2007 and 2008 vs Long-Term Concentrations Number of days with AQI >100 in 2008 appears to significantly depart from the long-term average for many cities.
Why 2007? Number of days with AQI >100 in 2008 appears to significantly depart from the long-term average for many cities.
AQ Modeling Domains 12 km US2 12 km EUS 12 km WUS 12 km AQMEII 36 km US
Non-Emission Components • Models • CMAQ v4.7.1 (plan to transition to v5.0 in early FY2013 depending outcome of evaluation of v5.0) CAMx v5.3 (checking with ENVIRON on timing and nature of updates) • Meteorology • Existing 2007 WRF v3.1 w/ MCIP v3.6 • Possibly update to WRF v3.3 later – depending on outcome of analysis/evaluation of updated version • Domain • Smaller 12US2 12km national US domain nested within 36km CONUS • Vertical Resolution • Existing 24 layer structure (may change with updated version of WRF) • Initial and Boundary Conditions • Existing 2007 GEOSChem outputs
New Methods: EGU CEMs SO2 Continuous Emissions Monitoring (CEM) data reports NOx and SO2 emissions Missing emissions are filled with “calculated” values that are larger than actual emissions to satisfy the requirements and the goals of CAMD’s trading programs Tool identifies “anomalous” data based on flags in the data and heat input Substitutes an alternative value based on hourly mean HI Able to differentiate partial and full year reporters ** methodology under development/refinement ** tool developed by SESARM and UNC-IE