Download
1 / 22
220 likes | 405 Views
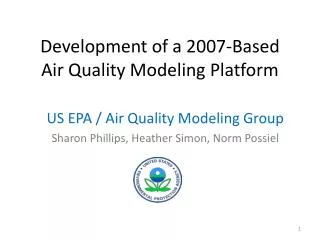
Development and Status of EPA’s 2011 Modeling Platform. October 29, 2013 Alison Eyth, Rich Mason, Alexis Zubrow. Glacier Bay, Alaska, June 2013. Purpose and Contents of a Modeling Platform. Modeling platforms are used to support EPA regulations and policy-related analyses Purpose:

E N D
Development and Status of EPA’s 2011 Modeling Platform October 29, 2013 Alison Eyth, Rich Mason, Alexis Zubrow Glacier Bay, Alaska, June 2013
Purpose and Contents of a Modeling Platform • Modeling platforms are used to support EPA regulations and policy-related analyses • Purpose: • To provide a comprehensive air quality modeling system using the most recent technically sound data and state-of-the-science tools available. • Major components: • Modeling domain • Air quality models, meteorological models and data, boundary and initial concentrations • Base year emissions data, projected future year emissions projections data, emissions modeling ancillary data and emissions modeling tools and scripts
2011 Platform Modeling Domain OAQPS, Emission Inventory and Analysis Group
2011 Modeling Platform • Used for Transport Rule, O3 NAAQS RIA, 2011 National Air Toxics Assessment, … • Supports both CMAQ and CAMx • WRF for meteorology • GEOSChem for initial and boundary conditions • Emissions based on 2011 NEI Version 1 • Non-US emissions included in the platform are: • Mexico 2012 (projected from 1999) • Canada 2006 OAQPS, Emission Inventory and Analysis Group
2011 National Emissions Inventory • Released September 30, 2013 (fastest ever) • http://www.epa.gov/ttn/chief/net/2011inventory.html • Data is submitted by states, locals, tribes and EPA into the Emissions Inventory System • Five categories • Point/Facility Inventory (point locations) • Nonpoint (county-based) • Onroad mobile sources • Nonroad mobile sources • Events (e.g., Fires) • EPA and S/L/T data is interleaved to create the NEI OAQPS, Emission Inventory and Analysis Group
Changes from 2008 to 2011 NEI (see poster by Madeleine Strum) OAQPS, Emission Inventory and Analysis Group
Emissions Modeling -High-level Overview • Emissions modeling converts annual (or monthly) point- or county-based inventories into hourly emissions for each model grid cell, in a format the air quality model can use • SMOKE is the emissions model used by EPA: http://smoke-model.org • Emissions Modeling Framework is used to manage data and model runs • EPA posts emissions platform data, once available, on the CHIEF Emissions Modeling Clearinghouse • http://www.epa.gov/ttn/chief/emch • Inventory and some activity data • Ancillary data for speciation and spatial and temporal allocation • Watch for 2011 platform to be posted soon! • Projected data for future years to be posted once available OAQPS, Emission Inventory and Analysis Group
Deriving Platform Inventories from the NEI OAQPS, Emission Inventory and Analysis Group • NEI data is output from EIS as ‘flat files’ for each category except fires • Point fire data developed for NEI and modeling platform • Point and nonpoint data is divided into modeling sectors according to how they are processed through SMOKE • Point -> ptegu*, ptegu_pk*, ptnonipm, pt_oilgas* • Nonpoint -> afdust, ag, c1c2rail, np_oilgas*, nonpt, rwc* • *indicates a new sector for 2011 platform • Great Lakes CMV emissions replaced with LADCO inventory • Missing ethanol plants added • NEI onroad and nonroad data are developed by running MOVES and NMIM, respectively, and then entering summarized data into EIS • Modeling sectors: onroad, onroad_rfl, nonroad • Special adjustments made for CA and TX to state-provided values • C3marine is point data in platform and shapes in NEI and has some differences in emission values
2011 Platform Onroad Emissions • 2011 NEI: MOVES activity data/inputs obtained directly from states for the first time • Using state inputs for VMT and VPOP but not fuels • Temporal profiles developed based on state inputs (Zubrow talk) • State inputs include inspection / maintenance programs, age distributions, etc. • MOVES county databases (CDBs) received from more than 30 agencies • EMFAC-based emissions for California (per their submittal) • SMOKE-MOVES used to generate NEI for most states • Provides hourly, speciated, gridded emissions for the AQM • Use of representative counties offers computational advantages and works with cloud computing • Representative counties updated for v1 based on input from states OAQPS, Emission Inventory and Analysis Group
EGU Temporal Profiles OAQPS, Emission Inventory and Analysis Group • Continuous Emissions Monitoring System (CEMS) data for NOx, SO2, and heat input is used to temporalize emissions when it is available • For sources without CEMS data, temporal profiles are derived from sources that do have data • Profiles take emissions from annual->month, month->day, and day->hour • Peaking units removed from the average profiles • Profiles developed for each IPM region and fuel • Fuel types used are coal, gas, and other • New for 2011: Year-specific temporalization to be preserved as much as possible into future years • New units in the future year are temporalized using the region and fuel-specific profiles
64 IPM Regions Used in v5.13 OAQPS, Emission Inventory and Analysis Group
Example of a Peaking Unit Emissions each day of the year OAQPS, Emission Inventory and Analysis Group
Example of Non-Peaking Units in July in Florida OAQPS, Emission Inventory and Analysis Group
Spatial Surrogates Use circa 2010 data (census, FEMA, National Transportation Atlas Database 2011) Oil and gas surrogate updates for Northeast and WRAP Commercial Marine Vessel improvements in Great Lakes and Gulf
Updated Oil and Gas Surrogates New Surrogate includes Marcellus shale region in the Northeast (has new emissions in 2011) WRAP States Updated OAQPS, Emission Inventory and Analysis Group
Commercial Marine Surrogates Older Great Lakes surrogates smeared emissions across the lakes Gulf surrogate needed due to C1C2 emissions now placed in Gulf OAQPS, Emission Inventory and Analysis Group
Recent SMOKE Updates OAQPS, Emission Inventory and Analysis Group • Support for source apportionment • Improved support for daily and hourly inventories (e.g., HAP integration) • Updates to SMOKE-MOVES • Optimization for faster run-time • Better use of gridded met data for off-network • Use of binned RH for on and off-network • Adjustment factors can be used in Movesmrg • NCEP data can be used as input for non CONUS areas • Improved error checking • Incorporated Bash approach for ag NH3 temporalization
2011 Emissions Modeling Platform Development: Steps and Timing
Evolution of Modeling Platform 20 • Components of modeling platform are “evolutionary” and not static • Emissions, meteorological, and air quality models are updated by developers on a semi-regular basis; though not necessarily in sync with the timing of our rules. • Emissions inventories are subject to updates and project-specific adjustments and refinements • Updated data and tools will be integrated into the platform over time • Updated versions of the 2011 platform will be used for modeling in 2014-2015
Ongoing work Improving methods for RWC emissions estimates Improving oil and gas emissions estimates, spatial allocation, and speciation Refining c1c2 CMV emissions distribution / estimates Improving base year (NEI) controlsinformation & industrial non-EGU projections Updating biogenic land use and emissions factors (ORD) Continue to integrate Fire Emissions Tracking System (FETS) data into SmartFire (SF2) to improve ID & classification of fires Reviewing stack parameters for reasonableness Obtaining updated Canada/Mexico (base and future year) OAQPS, Emission Inventory and Analysis Group
Acknowledgements UNC IE CEMPD: Zac Adelman, Limei Ran, Catherine Seppanen ENVIRON: Michele Jiminez, Tejas Shah, Amnon Bar-Ilan, Greg Yarwood National Air Data Group: Jon Miller, Martin Husk EIAG Data Analysis Team: Venkatesh Rao, Lee Tooly, Josh Drukenbrod, Rhonda Thompson NEI Team: Ron Ryan, Laurel Driver, Roy Huntley, Jennifer Snyder, Sally Dombrowski, Michael Heath EIAG Group Leader: Marc Houyoux AQMG: Norm Possiel, Brian Timin, Kirk Baker ORD: George Pouliot, Jesse Bash OAQPS, Emission Inventory and Analysis Group