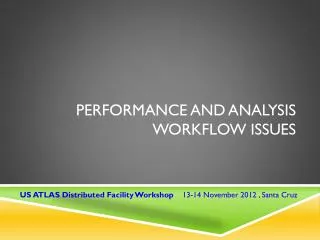
Improving Performance and Analysis Workflow Issues at ATLAS Distributed Facility
The workshop held on November 13-14, 2012, in Santa Cruz addressed critical issues faced by ATLAS analysis jobs on the grid. With a substantial increase in analysis jobs, many are inefficient and can disrupt storage and network resources. This project aims to monitor and enhance the performance of these jobs through a comprehensive framework incorporating real-time feedback. Key areas of focus include optimizing software configurations, improving resource utilization, and developing a web interface for performance indicators. The initiative is guided by the need for better insights into analysis job performance and realtime adjustments.

Improving Performance and Analysis Workflow Issues at ATLAS Distributed Facility
E N D
Presentation Transcript
Performance and AnalysisWorkflow Issues US ATLAS Distributed Facility Workshop 13-14 November 2012 , Santa Cruz
Importance of Analysis jobs • Number of analysis jobs are increasing • Production jobs are mostly CPU limited, well controlled, hopefully optimized and can be monitored through other already existing system • Analysis jobs we know very little about and potentially could: be inefficient, wreck havoc at storage elements, networks. Twice failure rate of production jobs Ilija Vukotic ivukotic@uchicago.edu
Analysis queues performance Idea • Find what is performance of ATLAS analysis jobs on the grid • There is no framework that everybody uses, that could be instrumented • Understand numbers: each site has it’s hard limits in terms of storage, cpus, network, software. • Improve • ATLAS software • ATLAS files, way we use them • Site’s configurations Requirements: • Monitoring framework • Tests simple, realistic, accessible, versatile as possible • Running on most of the resources we have • Fast turn around • Test codes that are “recommended way to do it” • Web interface for most important indicators Ilija Vukotic ivukotic@uchicago.edu
TEST framework HammerCloud WEB site • Continuous • Job performance • Generic ROOT IO scripts • Realistic analysis jobs • Site performance • Site optimization • One-off • new releases (Athena, ROOT) • new features, fixes • All T2D sites (currently 42 sites) • Large number of monitored parameters • Central database • Wide range of visualization tools SVN configuration, test scripts ORACLE DB CERN Results Ilija Vukotic ivukotic@uchicago.edu
Test framework Pilot numbers obtained from panda db • 5-50 jobs per day per site • Each job runs at least 24 tests • 5 read modes + 1 full analysis job • Over 4 different files • Takes data on machine status • Cross reference to Panda DB • Currently 2 million results in DB WEB site • http://ivukotic.web.cern.ch/ivukotic/HC/index.asp Ilija Vukotic ivukotic@uchicago.edu
Summary results Setup times Ilija Vukotic ivukotic@uchicago.edu
Summary results Stage-in The Fix Space for improvement 60 s = 41 MB/s Ilija Vukotic ivukotic@uchicago.edu
Summary results Execution time GPFS not mounted – can’t run in direct mode Ilija Vukotic ivukotic@uchicago.edu
Summary results Stage out Ilija Vukotic ivukotic@uchicago.edu
Summary results Total time = setup + stage in + exec + stage out [s] – as measured by pilot Ilija Vukotic ivukotic@uchicago.edu
Summary – Going deeper FACTS: Unless doing bootstrapping or some weird calculation, users code is negligible compared to unzipping. ROOT can unzip at 40MB/s CPU efficiency • Measures only event loop • Defined as CPU time / WALL time • Keep in mind – very slow machine can have very high CPU eff. • All you want to do is make it as high as possible Ilija Vukotic ivukotic@uchicago.edu
Summary – Going deeper CPU efficiency Direct access site Ilija Vukotic ivukotic@uchicago.edu
Going deeper - Case of switch stacking Test files are local to both UC and IU sites. Lower band is IU. Only part of the machines are affected. (the best ones) Ilija Vukotic ivukotic@uchicago.edu
Going deeper - Case of switch stacking We check CPU eff. VS. • Load • Network in/out • Memory • Swap Ilija Vukotic ivukotic@uchicago.edu
Case of switch stacking Machines can do much better as seen in copy2scratch mode. Drained node as bad as busy one. Manual checks show connections to servers much bellow 1Gbps. Stack performance depend on: • its configuration (software) • what is connected where Optimal switch stacking not exactly trivial. I suspect a lot of sites have the same issues. NET2 and BNL show very similar pattern. Will be investigated till the bottom. Ilija Vukotic ivukotic@uchicago.edu
Finally • Two big issues discovered. Just that was worth the effort • Bunch of smaller problems with queues, misconfigurations found and solved FUTURE • Fixing remaining issues • Investigate Virtual Queues • Per site web interface • Automatic procedure to follow performance • Automatic mailing • Investigating non-US sites Ilija Vukotic ivukotic@uchicago.edu
Workflow issues Analyzing data • Mostly local queues • Rarely proof • People willing to wait for few hours and manually merge results For most users this is the workflow: • Skimming/slimming data • usually prun and no complex code • often filter_and_merge.py • Merging data • only part of people do it • unclear how to do it on the grid • moving small files around very inefficient • Getting data locally • DaTRI requests to USA processed slowly • Most people dq2-get • Storing it locally • Not much space in tier-3’s • Accessing data from localgroupdisk Ilija Vukotic ivukotic@uchicago.edu
Slim skim service Idea Establish service to which users submit parameters of their skim&slim job, uses opportunistically CPU’s and FAX as data source and provides optimized dataset. Practically • WebUI to submit request and follow job progress • Oracle DB for a backend • Currently UC3 will be used for processing. • Output data will be dq2-put into MWT2 Work started. Performance and turn around time are what will make or brake this service. Ilija Vukotic ivukotic@uchicago.edu
appendix The Fix • timer_command.py is part of the pilot3 code. Used very often in all of the transforms. • Serves to start any command as a subprocess and kills it if not finished before a given timeout. Not exactly trivial. • For some commands was waiting 60 seconds even when command finished. • Was also trying to close all the possible file descriptors before executing child process. That could take from 0.5s – few tens of seconds depending on site’s settings. Fixed in the last pilot version. • Total effect estimate: • Quarter of computing time is spent on analysis jobs • Average analysis job is less than 30 min. • Fix speeds up job in average 3 minutes - 10% • Applied to 40 Tier2’s the fix equivalent of adding one full tier2 of capacity BACK Ilija Vukotic ivukotic@uchicago.edu