Download
1 / 32
320 likes | 419 Views
Explore the structural changes in agriculture, importance, challenges, and modernization trends in the agricultural sectors of the USA and Spain from 1900 to present.

E N D
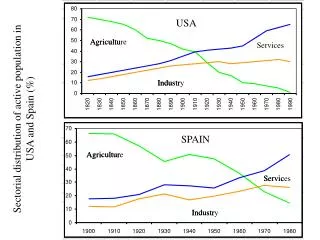
80 70 USA 60 Agricultu Agriculture 50 Services 40 30 20 Industry Industr 10 0 1860 1870 1880 1890 1900 1910 1920 1930 1940 1950 1960 1970 1980 1990 1820 1830 1840 1850 70 SPAIN 60 Agriculture Agricultur 50 40 Servic Services 30 20 Industr Industry 10 0 1900 1910 1920 1930 1940 1950 1960 1970 1980 Sectorial distribution of active population in USA and Spain (%)
AGRICULTURE • Structural change: from agriculture to industry and services • Importance of agriculture • Finance the rest of the sectors • Supplier of cheap labor force • To secure the supply of food (nutritious, healthy, ecological) • Demand industrial goods and services • Preservation of rural environment • More international competition and liberalization
Traditional agriculture →→ modern agriculture • Problems since 1950: low productivity, low agricultural income, conflicts in property TRADITIONAL • Abundant and cheap labor force • Low capitalized • SS ≤ DD • Irregular property MODERN • More expensive labor force • Very capitalized • SS > DD • New problems
New problems • Agricultural surplus • Greater international competition • Environment • The weight of Spanish agricultural sector is higher than in EU • Agriculture sector very imbedded in national economy: • Inputs (fertilizers, machinery, seeds, gasoline) • Outputs (sales to wholesalers) • Bank financing
The loss of positions of agriculture sector in the Spanish economy, 1985-2005 (%) Situation nowadays: • Production and income • Productive and commercial specialization • Productive efficiency
A. Production and income ↓ Agriculture income • Higher dependence on more expensive inputs • Amortizations of capitalization > FAP • PCI > selling prices of FAP ↑ Agriculture income • Subsidies • Lower occupation, so this increases per capita income >
B. Productive and commercial specialization • Supply adapted to demand • Specialization in meat, milk, fruits and vegetables • Dependence in soybean, corn and barley • The entry in EU provoked: • Higher (last) specialization • Higher competition taking advantage of comparative advantages in meat, fruits, oil and vegetables • Danger of international competition (LDC´s)
C. Productive efficiency • Apparent labor productivity = = GAV / Labor force • Productivity depends on: • Technology • Factorial allocation
Chemical-biological tech. Mechanical technologies 1. Technology • GAV/Labor force = GAV/Agric Surface (AS) * AS/Labor force • In spite of having small plots, farmers have used a lot of mechanical technologies because they rent them and they are relatively cheap (with respect to labor force) • Low productivity with respect to EU because they use chemical-biological technologies (+ for environment). This difference is diminishing.
2. Factorial allocation • Capitalization: mechanization, irrigable, etc. • Aged agriculture employment, familiar lands, part-time work • 2 kinds of lands: • Lot of very small plots (where predominate ) • Fewer big plots, with higher productivity, wage workers, dynamics, exposed to international competition • Integration with the rest of the economy
COMMON AGRICULTURE POLICY • Objectives: • Increase productivity • Guarantee the level of life of farmers • Stabilize markets • Guarantee the supply of population • General principles: • Market unity • Community preference • Financial solidarity
95% GUARANTEE section 50% EU budget EAGGF GUIDANCE section CMO´s • Problems of CAP • A lot of surplus • Huge financial costs • Promote continental productions • Benefit bigger lands • Small funds to orientation section • Protectionism, complaints filed from outside UE 5%
CAP reforms • Partial reforms in 1984: • Corresponsability tax • Quotas • Lands and animals retired • 1992 reform: • ↑ guarantee prices • Substitute helps for production • Discourages chemical-biological technologies • Protect environment and rural places • New reforms (1999, “2000 Agenda”) • Future projects
INDUSTRIAL SECTOR • Basic sector for economic development • Spain: growth from 1950´s to 1960´s • But afterwards lose importance, because of its higher dependence on the other sectors: • Agriculture sector efficient for traditional industries • Services of high quality (financing, energy, telecommunications)
High High Low Low CLASSIFICATIONS • DEMAND • Income elasticity • SUPPLY • Technological intensity • MIXED • Advanced (office machinery, computers, electric and electronic machinery, precision instruments, aeronautic and space, y pharmaceutics) • Medium (chemical, rubber and plastic, mechanical machinery and material transport) • Traditional (basic metallic, metallic products, non-metallic mineral product, food, paper, textile and confection, wood and other manufactures)
Characteristics of advanced industries (compared to traditional industries): • Low intensity in labor and natural resources • Very intense in capital, technology and human capital (high labor productivity, high added value) • Greater dimension of establishments • More dynamic, competitive and globalized markets (attractive sectors) • With more foreign capital
Evolution of industrial sector • Compared with other sectors: • 1960-75: The key sector of the Spanish development, pulling the rest of the sectors: ↑ L productivity, ↓ prices (-) protectionism, local demand • 1975-85: Industrial crisis, in supply (oil, wages) and in demand (local) • 1985-2005: services take over the key economic role from industry. But is still + competitive, + inputs exporter and importer • Compared to EU: very competitive sector (in spite of the serious crisis of 1970´s)
Role of industry sector in the Spanish economy 1966-2006 (%) • Reduction of industry in Spain (services) : ↑ productivity, ↓ prices, internationalization • Increase of industry comp. to EU (competition) • Domestic demand increase more than industry: ↓ competition in some sub-sectors, ↑ importations
Productive and commercial specialization 1960 2004 Traditional ind. 70 % 59 % Advanced ind. 4 % 11 % • Why does this specialization exist?: • Low entrepreneur dimension • Plentiful and cheap labor force and natural resources • Physical capital, human capital, and technology less abundant, (because of economic backwardness) • Standardized technologies • Advanced industries controlled by foreign capital
Productive efficiency:LABOR PRODUCTIVITY • Industrial growth <=> labor productivity, because: • Capitalization of establishments • Increase of technology and human capital • Specialization in advanced industries • Improvement in product quality and price • Going down since 1975, because: • Decrease in product growth • Decrease in capital investment and technology • Increase in labor cost • Decrease in entrepreneur benefits • Deficient management training • Increase in the price of services
Industrial policy: towards lower industrial public intervention • Autarchy (1938-1963): INI, industrial regulations, protectionism • 1960-75: partial liberalization • 1975-85: crisis, industrial re-conversion • Since 1986: low intervention. Problems: • Lack of help to SME • Deficient technological policy • Low competitive services
SERVICES • The most important sector in Spain and in rich countries (production and employment ≈ 60-70 %) • Strategically importance : • Its efficiency affects other productive sectors (banking, transports, telecommunications) or social wealth (health, education) • The new economy: new technologies, productivity improvement, macroeconomic stability
Difficulty to define • Classifications: • Market vs. non-commercialized • Final consumption vs. intermediate consumption • Stagnated vs. progressive • Problems: • A lot of non-commercialized services • Hard to weigh and compare the quality of different services • Services produced inside the firm
General evolution of services in Spain • Increase of nominal production • Same real production • Increase of prices • Increase of employment • Low productivity • Isolation from international competition
Role of service sector in the Spanish economy 1966-2006 (%)
Evolution of Productivity and Prices in the traditional sectors (1985-2006) • Supply explains better than demand • New technologies let services be more progressive if you can take advantage and assimilate them
Productive and commercial specialization • ↑ non-commercialized services • Commercial distribution: • Problems of price and productivity • Excessive regulation, small firms • Hotel trade: • Big expansion because of tourism • Low productivity because of small firms
Transport and communications: • Technological advances • Higher productivity and lower prices • Trade specialization • High competitivity of tourism firms • Competitive disadvantages in the other services, overall in financial services • Growing presence in computer services
Productive efficiency • Very low productivity (↑ production ↑ employ) • Causes: • Difficulties introducing technology • Scarce local competition because of high regulation • Consequences: ↑ prices
Differences in productivity and price growth between services and industry in Spain, 1981-2004 (%)
Sector policies • Very regulated historically • 1980´s, anti-regulation in theory and practice: • Take away regulations • New regulations to obtain competition • Measures: • Industry, reduce tariffs • Mobility of producers and consumers • Freedom of open firms • New technologies • European Union
Deregulation in Spain • Starts in the second half of the 1990´s • Gradual and unequal deregulation: • Telecommunications • Air transport • Commercial distribution • Pharmacies, petrol distribution