Download
1 / 19
190 likes | 353 Views
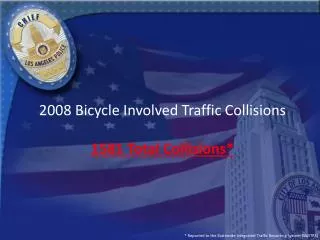
2008 Bicycle Involved Traffic Collisions 1581 Total Collisions*. * Reported to the Statewide Integrated Traffic Reporting System (SWITRS). PRIMARY COLLISION FACTORS. Red Light & Stops 13%. Right of Way/Yield 14%. Unsafe Turns 14%. Lane Change/Passing 7%. Unsafe Speed 6%.

E N D
2008 Bicycle Involved Traffic Collisions 1581 Total Collisions* * Reported to the Statewide Integrated Traffic Reporting System (SWITRS)
PRIMARY COLLISION FACTORS Red Light & Stops 13% Right of Way/Yield 14% Unsafe Turns 14% Lane Change/Passing 7% Unsafe Speed 6% Driver Inattention 3% Other/Undetermined 18% 21453(a) (89/205) 22450(a) (57/205) 21802(a) (59/205) 21804(a) (184/224) 21950(a) (28/224) Other (12/224) 21801(a) (103/219) 22107 (75/219) Other (41/219) 21202(a) (41/106) 21658(a) (33/106) Other (32/106) 22350 (92/92) 22106 (28/50) 22517 (22/50)
INJURY SUMMARY Note: Based on 1581 Collisions. All injuries sustained by cyclists and pedestrians as well as severe and fatal sustained by motor vehicle occupants considered. Minor injuries sustained by drivers/passengers not counted. PDO refers to Property Damage Only.
INJURY TYPE ALL ACCIDENTS/ALL VEHICLES Fatal 1%< Severe 2% Other Visible 17% Complained of Pain 48% No Injury 33% 37,828 COLLISIONS
INJURY TYPE BICYCLE RELATED ACCIDENTS Fatal 1%< Severe 6% Other Visible 47% Complained of Pain 41% No Injury/PDO 5% 1 Fatal is Pedestrian 1 Severe is Driver
FATAL AND SEVERE CYCLE RELATED INCIDENTS BY PRIMARY VIOLATION SECTION & VIOLATION TYPE (10 FATAL, 100 SEVERE ) Direction Violations 30% of Fatal 20% of Severe Red Light & Stops 20% of Fatal 16% of Severe Right of Way/Yield 13% of Severe Unsafe Turns 10% of Fatal 16% of Severe Lane Change/Passing 10% of Fatal 4% of Severe Unsafe Speed 20% of Fatal 8% of Severe Driver Inattention 2% of Severe Other/Undetermined 10% of Fatal 21% of Severe In 8 of these collisions there were secondary violations contributing.
OTHER VISIBLE INJURY BY PRIMARY VIOLATION TYPE 752 VISIBLE INJURIES (RAW NUMBER, PERCENTAGE)
COMPLAINED OF PAIN BY VIOLATION TYPE 650 COMPLAINED OF PAIN INJURIES (RAW NUMBER, PERCENTAGE)
MOST PREVALENT COLLISION FACTOR AND ASSOCIATED INJURY (TOP 10 VIOLATIONS)
HIT AND RUN ALL TYPES OF COLLISIONS 71 Collisions 37828 COLLISIONS IN CITY OF LOS ANGELES
HIT AND RUN STATISTICS FOR BICYCLE INVOLVED COLLISIONS Hit/Run as proportion of all Collisions Misdemeanor Hit/Run Injuries 71 Collisions Hit/Run by Type Felony Hit/Run Injuries
Drugs/Alcohol Involved 72 Collisions
MONTH OF COLLISION # OF COLLISIONS MONTH
Fault Determination 1581 Collisions
DIVISION OF OCCURRENCE 1581 Collisions