Download
1 / 8
80 likes | 136 Views
MATERIALS SCIENCE & ENGINEERING. Part of. A Learner’s Guide. AN INTRODUCTORY E-BOOK. Anandh Subramaniam & Kantesh Balani Materials Science and Engineering (MSE) Indian Institute of Technology, Kanpur- 208016 Email: anandh@iitk.ac.in, URL: home.iitk.ac.in/~anandh.

E N D
MATERIALS SCIENCE & ENGINEERING Part of A Learner’s Guide AN INTRODUCTORY E-BOOK Anandh Subramaniam & Kantesh Balani Materials Science and Engineering (MSE) Indian Institute of Technology, Kanpur- 208016 Email:anandh@iitk.ac.in, URL:home.iitk.ac.in/~anandh http://home.iitk.ac.in/~anandh/E-book.htm Phase Diagrams: a Detailed Study Advanced Reading Alloy Phase Equilibria A. Prince Elsevier Publishing Company, Amsterdam (1966) Collection of Phase Diagrams http://www.crct.polymtl.ca/fact/documentation/SGTE/SGTE_Figs.htm
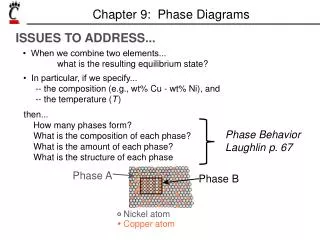
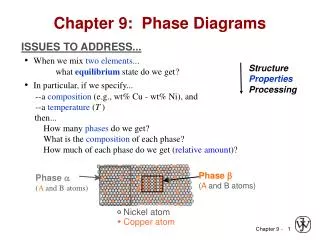
Illustrative Examples of Phase Diagrams • In the mail chapter on phase diagrams some basics of phase diagrams were considered. • In this sub-chapter we consider: a detailed treatment of phase diagrams and an illustrative set of phase diagrams (i.e. examples of various types of phase diagrams).
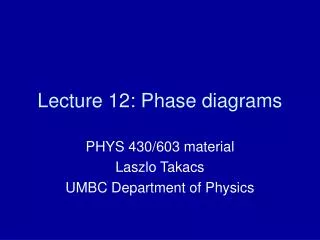
Getting Phase diagrams from Gibbs free energy versus composition plots • By drawing G vs Xi (composition) plots for various temperatures we can obtain T vs Xi phase diagrams.
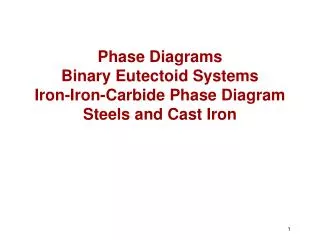
Getting the Eutectic Phase diagram from Gibbs free energy versus composition plot • By drawing
Gibbs free energy vs composition plot at various temperatures: Isomorphous system
Gibbs free energy vs composition plot at various temperatures: Eutectic system
Gibbs free energy vs composition plot at various temperatures: Peritectic system