Quality Tools and Techniques
Quality Tools and Techniques. Quality Control Tools. Pareto chart Histogram Process flow diagram Check sheet Scatter diagram Control chart Run chart Cause and effect diagram. Pareto Principle. Vilfredo Pareto (1848-1923) Italian economist 20% of the population has 80% of the wealth

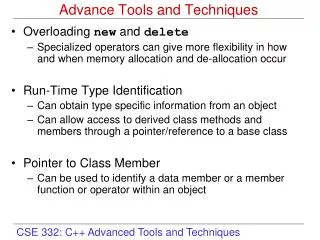
Quality Tools and Techniques
E N D
Presentation Transcript
Quality Tools and Techniques Quality Improvement: Problem Solving
Quality Control Tools • Pareto chart • Histogram • Process flow diagram • Check sheet • Scatter diagram • Control chart • Run chart • Cause and effect diagram Quality Improvement: Problem Solving
Pareto Principle • Vilfredo Pareto (1848-1923) Italian economist • 20% of the population has 80% of the wealth • Juran used the term “vital few, trivial many”. He noted that 20% of the quality problems caused 80% of the dollar loss. 7 Quality Tools Quality Improvement: Problem Solving
Pareto chart % Complaints 7 Quality Tools Quality Improvement: Problem Solving
70 60 50 40 30 20 10 0 Pareto Chart (64) Percent from each cause (13) (10) (6) (3) (2) (2) Poor Design Defective parts Operator errors Machine calibrations Defective materials Surface abrasions Wrong dimensions Causes of poor quality Quality Improvement: Problem Solving
Histogram 7 Quality Tools Quality Improvement: Problem Solving
40 35 30 25 20 15 10 5 0 1 2 6 13 10 16 19 17 12 16 20 17 13 5 6 2 1 Histogram Quality Improvement: Problem Solving
Flowcharts • Flowcharts • Graphical description of how work is done. • Used to describe processes that are to be improved. 7 Quality Tools Quality Improvement: Problem Solving
Flow Diagrams " Draw a flowchart for whatever you do. Until you do, you do not know what you are doing, you just have a job.” -- Dr. W. Edwards Deming. Quality Improvement: Problem Solving
Flowchart Activity Decision Yes No 7 Quality Tools Quality Improvement: Problem Solving
Flowchart Quality Improvement: Problem Solving
Process Chart Symbols Operations Inspection Transportation Delay Storage
Date: 9-30-00 Location: Graves Mountain Analyst: TLR Process: Apple Sauce Step Operation Transport Inspect Delay Storage Description of process Distance (feet) Time (min) 1 Unload apples from truck 20 2 Move to inspection station 100 ft 3 Weigh, inspect, sort 30 4 Move to storage 50 ft 5 360 Wait until needed Move to peeler 6 20 ft 7 Apples peeled and cored 15 8 Soak in water until needed 20 9 5 Place in conveyor 10 Move to mixing area 20 ft 11 30 Weigh, inspect, sort Page 1 0f 3 Total 480 190 ft Process Chart Quality Improvement: Problem Solving
Check Sheet Shifts Defect Type 7 Quality Tools Quality Improvement: Problem Solving
COMPONENTS REPLACED BY LAB TIME PERIOD: 22 Feb to 27 Feb 1998 REPAIR TECHNICIAN: Bob TV SET MODEL 1013 Integrated Circuits|||| Capacitors |||| |||| |||| |||| |||| || Resistors || Transformers|||| Commands CRT | Check Sheet Quality Improvement: Problem Solving
Cause-and-Effect Diagrams • Show the relationships between a problem and its possible causes. • Developed by Kaoru Ishikawa (1953) • Also known as … • Fishbone diagrams • Ishikawa diagrams 7 Quality Tools Quality Improvement: Problem Solving
Cause and Effect “Skeleton” Materials Procedures Quality Problem People Equipment 7 Quality Tools Quality Improvement: Problem Solving
Measurement Human Machines Out of adjustment Poor supervision Faulty testing equipment Lack of concentration Tooling problems Incorrect specifications Improper methods Old / worn Inadequate training Quality Problem Inaccurate temperature control Poor process design Defective from vendor Ineffective quality management Not to specifications Dust and Dirt Material- handling problems Deficiencies in product design Environment Materials Process Fishbone Diagram Quality Improvement: Problem Solving
Cause and effect diagrams • Advantages • making the diagram is educational in itself • diagram demonstrates knowledge of problem solving team • diagram results in active searches for causes • diagram is a guide for data collection Quality Improvement: Problem Solving
Cause and effect diagrams To construct the skeleton, remember: • For manufacturing - the 4 M’s • man, method, machine, material • For service applications • equipment, policies, procedures, people Quality Improvement: Problem Solving
Scatter Diagram . Quality Improvement: Problem Solving
Run Charts • Run Charts (time series plot) • Examine the behavior of a variable over time. • Basis for Control Charts Quality Improvement: Problem Solving
Control Chart 27 24 UCL = 23.35 21 c = 12.67 18 15 Number of defects 12 9 6 LCL = 1.99 3 2 4 6 8 10 12 14 16 Sample number Quality Improvement: Problem Solving
Control Charts Quality Improvement: Problem Solving 7 Quality Tools