Download
1 / 45
450 likes | 679 Views
Two Complementary Approaches to the HIV Care Cascade. ICAP Data Dissemination Meeting Matthew Lamb & Molly McNairy March 13, 2014. Number of selected activities at supported facilities, July-September, 2013. Number of facilities. Source: ICAP Site Census , November 2013

E N D
Two Complementary Approaches to the HIV Care Cascade ICAP Data Dissemination Meeting Matthew Lamb & Molly McNairy March 13, 2014
Number of selected activities at supported facilities, July-September, 2013 Number of facilities Source: ICAP Site Census, November 2013 Note: Some facilities offer more than one activity.
Cumulative enrollment in HIV care and treatment, by quarter As of September 2013: 1,787,682 enrolled in care 971,893 initiated ART 1,474 clinics Number of patients Number of clinics Source: ICAP URS November 2013. Note: Includes adults and children. Data are from all clinics ever supported.
Cumulative pediatric enrollment in HIV care and treatment, by quarter As of September 2013: 159,734 enrolled in care 86,010 initiated ART 1,474 clinics Number of patients Number of clinics Source: ICAP URS November 2013. Note:Data are from clinics ever supported.
Median CD4 count at baseline, 6 and 12 months after ART initiation, by country, July-September, 2013 CD4 Cell Count (cells/ul) Source: ICAP URS November 2013 Notes: This reflects cumulative cohort data for patients followed 12 months. Baseline CD4 count is an average of 6 and 12 month cohort baseline data. Data are only from clinics currently supported and reporting.
Number of pregnant women attending ANC and receiving HIV testing, April 2007 – September 2013 As of September 2013: 4,660,865 attending ANC 4,067,373 HIV tested 3,282 clinics Number of clinics Number of women Source: ICAP URS November 2013. Notes: Data from clinics ever supported.
Type of ART regimen for PMTCT, by quarter Percent of women Source: ICAP URS November 2013 Notes: Multi-drug regimens include AZT/sd-NVP, AZT/3TC tail postpartum, HAART at 34 weeks. Data are only from clinics currently supported and reporting.
Number of new HIV patients screened for TB, April 2007-September 2013 As of September 2013: 949,693 enrolled in care 568,917 TB screened 1,566 clinics Number of clinics Number of patients Source: ICAP URS November 2013. Notes: Data are from clinics that ever reported.
Number of people tested for HIV, as of September 2013 As of September 2013 9,536,893 HIV tested 476,472 HIV+ 1,936 facilities Number of clinics Number of people Source: ICAP URS November 2013. Notes: Data are only from clinics currently supported and reporting.
Proportion of patients tested who were HIV+ and enrolled in care, by point of service, July-September 2013 Proportion of patients Source: ICAP URS November 2013 Notes:*Most data from VCT clinics comes from Ethiopia, which may decrease the overall prevalence found in VCT clinics. **Other includes: laboratory; family planning, well-baby, STI, and TB clinics; casualty/trauma; palliative care/hospice; customer care, cervical cancer screening; HIV care / ART (family testing); blood donation center; and other points of service.
Number of tests conducted, by type of test, as of September 30, 2013 As of September 2013: 1,334,098 CD4 count 606 laboratories 454,868 CD4 % 494,055 AFB 2,011,452 HIV rapid tests Number of laboratories Number of tests Source: ICAP URS November 2013. Notes: Data are from labs ever supported.
Upcoming SI Webinars March 27: Care and treatment and lab PFacTS Other: URS, logic models, DHIS and surveillance
Overview • Background • “HIV continuum of care” • How the continuum of care is typically measured • Measure the continuum using ICAP data • Traditional HIV Care Cascade • Alternative HIV Care Cascade • Use of both cascade approaches to inform a comprehensive assessment of patient outcomes and program performance
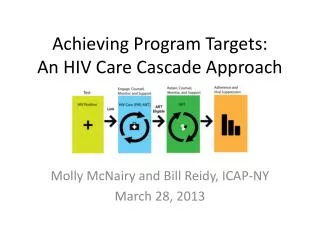
HIV Continuum of Care ART Eligible Link • A theoretical framework outlining essentials components of HIV care and treatment • Failure in any one step results in overall system failure: morbidity, mortality and HIV transmission McNairy, El-Sadr AIDS 2012
Why do we care about the continuum? 1.8 million 1 million HIV Care ICAP Care and Treatment Programs (2005-2013) ART
Background: Traditional Cascade The traditional HIV care cascade is a tool to map the HIV continuum of care using a series of steps • Each step is conditional on the previous step • Focus on treatment (ART) with common endpoint of viral load suppression
Literature: Cascades, Cascades, Cascades Gardner et al, CID 2011, CDC MMWR 2012, Kaygamba et al, Plos One 2012, Mugglin et al, Trop Med 2012
Background-2 • The traditional cascade provides incredibly useful information. • However, incomplete insight as it does not account for: • Outcomes for patients not on ART (Pre-ART) • The multiplicity of reasons for losses between steps • Timeframes for achievement of each step of the cascade • HIV programs expanding to include Pre-ART patients and there is a need to evolve the traditional cascade to include outcomes of these patients
Purpose of Study • To measure the traditional HIV care cascade amongadult HIV-infected patients enrolled in ICAP-supported HIV care and treatment facilities in sub-Saharan Africa • To develop an alternative cascade approachto: • Account for outcomes of all patients (Pre-ART+ART) • Identify reasons for losses across each step of cascade • Measure outcomes over time (i.e., 3, 6, 12 months)
Study Population and Setting • Routinely collected data on 390,603 adults (>15 years) enrolled in HIV care at 217 ICAP-supported care and treatment sites in 4 countries from 2005-2011 • Participants in The Identifying Optimal Models for HIV Care in Africa Study Kenya: 85 clinics 101,938 patients Rwanda: 41 clinics 32,105 patients Tanzania: 57 clinics 55,057 patients Mozambique: 34 clinics 201,503 patients
Methods Steps in this study’s cascade were adapted for available data
Methods-2 Population • Pre-ART: any patient not on ART (ART-ineligible, unknown eligibility, ART-eligible not initiated) • ART: any patient with documented initiation of ART Outcomes • Loss to follow-up (LTF) • ART: not attending a care visit > 6 months • Pre-ART: not attending care visit > 12 months • Death and transfers based on data in patient records • Retention: Percent known to be alive, not LTF, and attending clinic Methods • Kaplan-Meier to estimate cumulative incidence of retention after ART initiation
Traditional Cascade 89% 23% Number of adult HIV patients 48% 70% 78% Assessment for ART eligibility ART Retention at 12 months N = 390,603 patients at 217 clinics in Kenya, Mozambique, Tanzania, and Rwanda
Traditional Cascade Findings Outcomes of these patients not traditionally included Number of adult HIV patients ART Retention at 12 months Assessment for ART eligibility N = 390,603 patients at 217 clinics in Kenya, Mozambique, Tanzania, and Rwanda Source: ICAP patient-level database
Who is lost: after enrollment? 89% LTF 3% Death (recorded) 4% Transfer 3% Pre-ART retention Number of adult HIV patients (30%) (23%) Assessment for ART eligibility ART Retention at 12 months CD4/WHO stage within 12 months
Who is lost: after assessment for ART eligibility? 48% LTF 2% Death 26% ART initiation 8% Transfer 16% Pre-ART retention Number of adult HIV patients (30%) (23%) Assessment for ART eligibility ART Retention at 12 months CD4/WHO stage within 12 months
Traditional Cascade Findings 89% Number of adult HIV patients 48% 70% 78% ART Retention at 12 months Assessment for ART eligibility N = 390,603 patients at 217 clinics in Kenya, Mozambique, Tanzania, and Rwanda Source: ICAP patient-level database
Traditional Cascade By Country All countries end up at similar endpoint (22%-26%) ART retention at 12 months
Traditional Cascade What it can tell us? What is missing? Outcomes of all patients (Pre-ART, transfers) Reasons for losses across each step Timeline • % of patients achieving each step • % of patients lost across each step • Which step is the “weakest” link in the cascade • Use of common desired cascade endpoint (VLS, ART retention) which is essential for optimized patient outcomes
Alternative Cascade Approach Optimal Retained, Transferred Retained but did not receive optimal care, missing data Suboptimal Poor LTF, Death • All patients followed across time • Each step begins not from previous step but from enrollment • Outcomes of the entire cohort are described • Outcomes are categorized
Alternative Cascade 390,603 Optimal Outcomes Retained ART-ineligible 58% Initiated ART 51% % of adult HIV patients 49% Retained on ART Transfer out Time (months) since HIV care enrollment
Alternative Cascade 390,603 Suboptimal Outcomes Retained ART-eligible but not initiated Retained indeterminate eligibility % of adult HIV patients Time (months) since HIV care enrollment
Alternative Cascade 390,603 Poor Outcomes LTF (Pre-ART) Death (Pre-ART) % of adult HIV patients LTF (ART) Death (ART) Enrollment Time (months) since HIV care enrollment
Alternative Cascade Summary Optimal 20% Suboptimal 37% 44% Poor 22% 100% 12% % of adult HIV patients 7% 56% of patients retained 58% 49% 51% Enrollment Time (months) since HIV care enrollment
Alternative Cascade: Mozambique Optimal Suboptimal Poor % of adult HIV patients 201,503 patients (52% of all patients) 34 Clinics (16% of all clinics) Time (months) since HIV care enrollment
Alternative Cascade: Tanzania Optimal Suboptimal Poor % of adult HIV patients 55,057 patients (14% of all patients) 57 Clinics (26% of all clinics) Time (months) since HIV care enrollment
Alternative Cascade: Kenya Optimal Suboptimal Poor % of adult HIV patients 101,938 patients (26% of all patients) 85 Clinics (39% of all clinics) Time (months) since HIV care enrollment
Alternative Cascade: Rwanda Optimal Suboptimal Poor % of adult HIV patients 32,105 patients (8% of all patients) 41 Clinics (19% of all clinics) Time (months) since HIV care enrollment
Summary Traditional Alternative
Summary by Country Traditional Alternative
Conclusions Complementary approaches • Traditional cascade • focuses on treatment with overarching programmatic goal of continued successful retention and adherence • Identifies modifiable bottlenecks in achieving that goal • ART eligibility ART initiation • Alternative cascade • Focuses on outcomes of all patients (Pre-ART and ART) • Pre-ART losses are the majority of poor outcomes • Shows large heterogeneity between country programs
Conclusions-2 • Neither study cascade includes the desired start point(s) • HIV infection • HIV diagnosis • Linkage to HIV care • The ultimate value of HIV care cascades is to inform the design and implementation of multicomponent interventions that achieve desired patient outcomes and population impact
Applying to ICAP…next steps • Utility for • routine program monitoring and evaluation? • assessing impact of interventions targeting key steps in the continuum of HIV care? • Other applications?