Two approaches
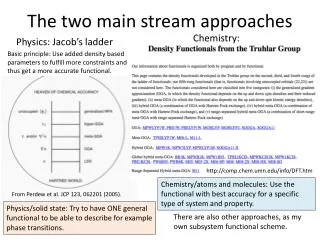
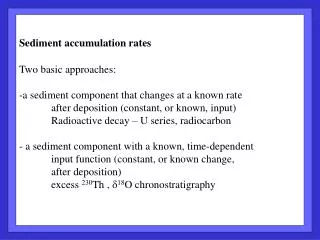
Two approaches. Sediment accumulation rates Two basic approaches: a sediment component that changes at a known rate after deposition (constant, or known, input) Radioactive decay – U series, radiocarbon a sediment component with a known, time-dependent

Two approaches
E N D
Presentation Transcript
Two approaches • Sediment accumulation rates • Two basic approaches: • a sediment component that changes at a known rate • after deposition (constant, or known, input) • Radioactive decay – U series, radiocarbon • a sediment component with a known, time-dependent • input function (constant, or known change, • after deposition) • excess 230Th , d18O chronostratigraphy
Radiometric dating Radiometric dating Dating principles – covered in Isotope Geochemistry (Faure) Two “simple” approaches: Average slopes from age vs. depth plots Absolute 14C dates for foraminiferal abundance maxima Normalization to constant 230Th flux Sediment focusing / winnowing Point-by-point mass accumulation rates
Terminology Terminology Radioactive parent daughter + - (electron) or (He nucleus) (or + or emission or e – capture or…) Isotopes: Same number of protons, differing numbers of neutrons chemically similar, different mass (kinetics), different radioactive properties
Decay rate Radioactive decay rate proportional to number of atoms present N is the number of parent atoms in the sample λ is the decay constant (units t-1) λN gives the activity (disintegrations/time)
Half life (Radioactive decay equation)
Half life Half life The time for 50% of atoms present to decay. Rule of thumb = radioisotope activity can be measured for about 5 half-lives
l values – motivation for atom-counting methods vs decay-counting!
Radioactive parent decaying to stable daughter ingrowth decay
230TH cartoon Cartoon 230Th profile (S = 2 cm/ky) Regress ln(A) vs. depth (z) ln(Az) = ln(Ao) – mz Decay eqn ln(Az) = ln(Ao) – lt = ln(Ao) – l(z/S) = ln(Ao) – (l/S)z
Assumptions for regressions of age vs. depth Accumulation without mixing below the mixed layer The isotope is immobile in the sediment Constant input activity (reservoir age), or known as a function of time Recall activity at time = 0 in the decay equation: How well do we know N(o) in the past?
Antarctic sediments – agreement between sed rates over two v. different timescales. DeMaster et al. 1991
Radiocarbon: Produced where? How? Natural variability in production? Natural variability in atmospheric 14C content? Human impacts on 14C budgets?
Produced in upper atmosphere, modulated by solar wind, earth’s magnetic field Faure
Natural variability in atmospheric 14C content? YES! Production variations (solar, geomagnetic) Carbon cycle (partitioning between atmosphere, biosphere, and ocean) At steady state, global decay = global production But global C cycle not necessarily at steady state, and 14C offsets between C reservoirs not constant.
Human impacts on 14C budgets? Seuss effect (fossil fuel dilution of 14C(atm)) Bomb radiocarbon inputs
14C-free 14C produced in atmosphere, but most CO2 resides in (and decays in) the ocean
Radiocarbon dating of sediments. Bulk CaCO3, or bulk organic C standard AMS sample 25 mol C (2.5 mg CaCO3) Specific phases of known provenance: Planktic, benthic foraminifera Specific (biomarker) compounds (5 mol C) Dating known phases (e.g., foraminifera), at their abundance maxima, improves the reliability of each date. No admixture of fossil (14C-free) material. Minimizes age errors caused by particle mixing and faunal abundance variations. But, reduces # of datable intervals.
Radiocarbon reporting conventions are convoluted! 14C data reported as Fraction modern, or age, or Δ14C t 1/2 ~ 5730 y (half life) λ= 0.00012097 / yr (decay constant) (about 1% in 83 years) Account for fractionation, normalize to 13C = -25 Activity relative to wood grown in pre-bomb atmosphere Stable carbon isotopic composition
Peng et al., 1977 bulk carbonate 14C Regress depth vs. age
3280 m 4675 m 14C in the sediment “mixed layer”
14C of atmosphere, surface ocean, and deep ocean reservoirs in a model. Ocean mixed layer reservoir age; lower 14C, damped high-frequency variations. Stuiver et al., 1998
Modern mixed layer reservoir age corrections, R. Reservoir age = 375 y +/- R. Large range; any reason R should stay constant?
Substantial variation, slope not constant; non-unique 14C ages Tree ring decadal 14C Tree ring age Stuiver et al., 1998
Production variations and carbon cycle changes through time Atmospheric radiocarbon from tree rings, corals, and varves. Calendar ages from dendrochronology, coral dates, varve counting. Stuiver et al., 1998
Bard et al. (’90; ’98) – U-Th on Barbados coral to calibrate 14C beyond the tree ring record. Systematic offset from calendar age. Reservoir-corrected 14C ages Calendar ages from dendrochronology and Barbados coral U-Th
The product of these radiocarbon approaches is an age-depth plot. Regression gives a sedimentation rate; linearity gives an estimate of sed rate variability. Typically, sedimentation rates do vary. How many line segments do you fit to your data? How confident are you in each resulting rate estimate? To estimate mass accumulation rates (MARs) Calculate average sedimentation rates between dated intervals, and multiply by dry bulk density and concentration. But: Average sed rates can’t be multiplied by point-by-point dry bulk density and concentration to yield time series. The solution – 230Th-normalized accumulation rates
Two approaches • Sediment accumulation rates • Two basic approaches: • a sediment component that changes at a known rate • after deposition (constant, or known, input) • Radioactive decay – U series, radiocarbon • a sediment component with a known, time-dependent • input function (constant, or known change, • after deposition) • excess 230Th , d18O chronostratigraphy
Flux estimates using excess 230Th in sediments (M. Bacon; R. Francois) Assume: 230Th sinking flux = production from 234U parent in the water column = constant fn. of water depth (uranium is essentially conservative in seawater) Correct sediment 230Th for detrital 230Th using measured 232Th and detrital 232Th/238U. Correct sediment 230Th for ingrowth from authigenic U (need approximate age model). Use an age model to correct the remaining, “excess” 230Th for decay since the time of deposition.
Two applications: • Integrate the xs230Th between known time points (14C, 18O). • Deviations from the predicted (decay-corrected) xs230Th inventory • reflect sediment focusing or winnowing. • Sample by sample, normalize concentrations of sediment constituents • (CaCO3, organic C, etc.) to the xs230Th of that sample. Yields flux • estimates that are not influenced by dissolution, dilution.
Point by point normalization: Activity(230) (dpm g-1) = Flux(230) (dpm m-2 y-1) Bulk flux (g m-2 y-1) So: Bulk flux (g m-2 y-1) = Flux(230) (dpm m-2 y-1) Activity(230) (dpm g-1) = Prod(230) (dpm m-3 y-1) x (water depth) Activity(230) (dpm g-1) And: Component i flux (g m-2 y-1) = Bulk flux (g m-2 y-1) x (wt % i)
Simple examples (without focusing changes): If % C org increases in a sample, but Activity(xs230Th) increases by the same fraction, then no increase in C org burial – just a decrease in some other sediment component. If % C org stays constant relative to samples above and below, but Activity(xs230Th) decreases, then the C org flux (and the bulk flux) both increased in that sample (despite lack of a concentration signal). But: To assess changes in focusing, we’re stuck integrating between (dated) time points.
Chronostratigraphy based on foraminiferal d18O values Two premises (observed): The d18O of seawater responds to changes in global ice volume - high-latitude precipitation is strongly depleted in d18O - more ice on continents => higher seawater 18O Foraminiferal d18O reflects seawater d18O - (but also temperature) Foraminiferal d18O provides a global stratigraphy Dating (radiometric, or orbital tuning) provides timescale
Calculated orbital variations Imbrie et al., 1984
Planktonic foraminiferal d18O (ice volume and water temperature) Imbrie et al., 1984 Bruhnes-Matuyama geomagnetic reversal in some cores
d18O vs. time Align control points (“wiggle matching”) to put cores on same time-scale. Assumption – the d18O time series reflect global signal (ice volume, and SST)
Normalize, stack, smooth Result: A reference d18O stratigraphy Timescale at base of stack set by radiometric dating (K/Ar on volcanic rock) of B/M reversal
Shackleton and Opdyke 1973 K/Ar age of Bruhnes/Matuyama reversal ~730 ky Age based on tuning to (assumed) orbital forcing is older. Shackleton et al. (1990): “K/Ar-based timescale underestimates true age by 5 – 8 %”