Download
1 / 37
370 likes | 460 Views
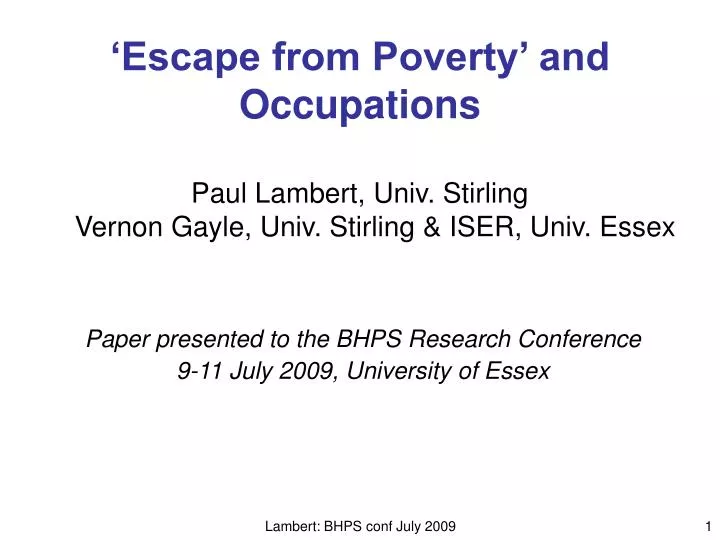
‘Escape from Poverty’ and Occupations Paul Lambert, Univ. Stirling Vernon Gayle, Univ. Stirling & ISER, Univ. Essex. Paper presented to the BHPS Research Conference 9-11 July 2009, University of Essex. ‘Escape from Poverty’ and Occupations.

E N D
‘Escape from Poverty’ and OccupationsPaul Lambert, Univ. Stirling Vernon Gayle, Univ. Stirling & ISER, Univ. Essex Paper presented to the BHPS Research Conference 9-11 July 2009, University of Essex Lambert: BHPS conf July 2009
‘Escape from Poverty’ and Occupations Or, ‘Occupational disadvantage and its relation to poverty and poverty transitions’ • Why occupations matter • How an occupational approach to measuring poverty could work • Some preliminary results Lambert: BHPS conf July 2009
Some background • Research on stratification, inequality, poverty • Whole distribution, cf the most disadvantaged • E.g. Poverty as < 50% median; ‘Underclass’ as lacking assets; etc • Direct v’s indirect measures of poverty (e.g. Gordon, 2000, 2006) • Absolute or relative measures • Sociology – primacy of the occupation • Economics, Social Policy: primacy of income and work-based income (e.g. UK ‘welfare to work’ policies influenced by income considerations) • Notion of a latent, underlying, socially embedded occupation as an indirect measure of poverty...? Lambert: BHPS conf July 2009
1) Why occupations matter Some claims about occupations: • Occupations matter more than other things • Occupational inequality is mostly one-dimensional • Occupational information resources are under-used, and this causes bad science *Quote as highlighted in Coxon and Jones (1978: 10) “Nothing stamps a man as much as his occupation. Daily work determines the mode of life.. It constrains our ideas, feelings and tastes” (Goblot, 1961)* Lambert: BHPS conf July 2009
(i) Occupations matter more ‘Gissa job’; ‘I can do that’ From http://www.bbc.co.uk/liverpool/content/articles/2007/10/09/boys_from_the_blackstuff_feature.shtml Lambert: BHPS conf July 2009
(i) Occupations matter more • We behave as if they do • Define our lifestyles • Define structures of social inequality b) Lifestyles A large body of sociological evidence on the social meaning of occupations – define friendships, marriage, leisure, consumption, and social reproduction itself (e.g. Devine 2004, Pettinger et al. 2005; Guveli et al. 2007; Archer 2007; Bottero et al. 2009) “A man’s work is as good a clue as any to the course of his life and to his social being and identity” (Hughes, 1958) Lambert: BHPS conf July 2009
A specially selected table… Source: BHPS 2007, currently employed adults, predictors of smoking (additional controls for age and gender) Lambert: BHPS conf July 2009
c) Occupations define structures of social inequality • Occupations are convenient markers of major social inequalities • Occupations (division of labour) are the primary driver of the structure of social inequality Empirical evidence.. • Reaffirms economic significance of jobs • (McGovern et al, 2007; ) • Rejects thesis of diminished structural significance of occupations in modern society • (Blossfeld et al., 2006) • Highlights centrality of occupations in contours of other social divisions • (e.g. immigration - Waldinger and Lichter, 2003) Lambert: BHPS conf July 2009
[Occupational not geographical inequality – cf. Burrows & Crow 2006] Lambert: BHPS conf July 2009
Occupations ‘stamp’ the life-course… Lambert: BHPS conf July 2009
..occupations and life-time lifestyles.. Lambert: BHPS conf July 2009
ii) Occupational inequality is mostly one-dimensional Lambert: BHPS conf July 2009
Histograms go here Lambert: BHPS conf July 2009
iii) Occupational information resources are under-used, and this causes bad science • Detailed occupational data is important • e.g. Weeden & Grusky (2005) • Handling of detailed occupational data is generally poor • Re-coding to simplified categorisations • Ignoring complex data (e.g. careers; gender seg.) • For more and more (and more) on this see • www.dames.org.uk • Lambert et al (2007) Lambert: BHPS conf July 2009
2) How an occupational approach to measuring poverty could work • Notion of a latent, underlying, socially embedded occupation as an indirect measure of poverty...? • CAMSIS scales: relative social advantage typically associated with incumbents of occupational positions over lifetime (Stewart et al, 1980) • Non-working have ‘latent’ occupations easily measured by socially significant links (e.g. household sharing; career; parents) • ..this may not be the same as current objective conditions... • Apparently straightforward decision to make defining a threshold level of the average social advantage typically associated with incumbents of the occupational position Lambert: BHPS conf July 2009
All jobs, male scale: threshold=38.51Occupational unit groups with > 90 in BHPS sample Remember that these jobs’ scores are cross-classified by employment status
Female jobs, female scale: threshold = 38.45Occupational unit groups with > 50 females in BHPS sample
Assigning occupations to all: parsimonious cross-sectional strategy..? • Modified Household ‘dominance’ approach • Use the most advantaged occupation within the household, prioritising ft work (e.g. Erikson, 1984), and recognising gender of occupation-holder • For students, parental jobs may be used • For those in household without job.. • Retrospective questions on last main job • Parental jobs used for those aged < 30 • ?Possible weighting factor for unemployment dur.? Lambert: BHPS conf July 2009
No occupational data - BHPS wave 17 (2007) Lambert: BHPS conf July 2009
Correlations between measures, BHPS, w17 individuals.These low correlations reflect people making 1 poverty threshold and not another Lambert: BHPS conf July 2009
Selected correlations with binary poverty indicatorsBHPS wave 17 excluding NI, N=12448
3) Some preliminary results Lambert: BHPS conf July 2009
..preliminary results.. Lambert: BHPS conf July 2009
(Model shows coefficient B and t statistics for logit models predicting whether individuals are in poverty by alternative measures. BHPS waves 9-17 with HW standard error adjustment. Additional controls for age, gender). Lambert: BHPS conf July 2009
(Model shows coefficient B and t statistics for random effects logit models (xtlogit) predicting whether individuals leave poverty given they were in the previous year, by alternative measures. BHPS waves 9-17. Additional controls for age, gender). Lambert: BHPS conf July 2009
4) Conclusions ‘Escape from social disadvantage’ and occupations • Occupational measures as feasible indirect indicators of relative poverty/disadvantage for the whole population • Reduce demographic/life-stage influence cf. income measures • Measurement challenges • Reflecting current circumstances [vulnerability to poverty, Gordon 2006] • Other alternative measures (e.g. using Unemployment data) • The concept of poverty • Implicitly absolute concept? • Implicitly longitudinal (a thing to escape), but is this over-optimistic? • Measurement & social science disciplines [Grusky & Kanbur 2007] • What determines social disadvantage/poverty? • Disadvantage is more stable than income-based measures show • Education and social background matters more than is recognised • Family status / demographics matter less • ‘Welfare to work’ is flawed? Lambert: BHPS conf July 2009
The bottom line… • There are a core of people who experience social disadvantage which is often longer term & fairly stable • We ought to identify and provide welfare support to the disadvantaged • If we use income based poverty indicators we often identify the wrong people • ..and make poor policy decisions.. • E.g. of the UK’s ‘Working Families Tax Credits’ • Occupational data might be parsimoniously used as an alternative indicator of social disadvantage Lambert: BHPS conf July 2009
Data sources • University of Essex, & Institute for Social and Economic Research. (2009). British Household Panel Survey: Waves 1-17, 1991-2008 [computer file], 5th Edition. Colchester, Essex: UK Data Archive [distributor], March 2009, SN 5151. • General Register Office for Scotland, 2001 Census: Standard Area Statistics (Scotland) [computer file]. ESRC/JISC Census Programme, Census Dissemination Unit, Mimas (University of Manchester) • Halpin, B. (2006). British Household Panel Survey Combined Work-Life History Data, 1990-2005 [computer file]. 5th ed. Colchester, Essex: Institute for Social and Economic Research, [original data producer(s)]. UK Data Archive [distributor], November 2006. SN: 3954. . • Minnesota Population Center. (2008). Integrated Public Use Microdata Series - International: Version 4.0. Minneapolis: University of Minnesota. • Office for National Statistics. Social and Vital Statistics Division and Northern Ireland Statistics and Research Agency. Central Survey Unit, Quarterly Labour Force Survey, January - March, 2008 [computer file]. 2nd Edition. Colchester, Essex: UK Data Archive [distributor], October 2008. SN: 5851. • Prandy, K., & Bottero, W. (1998). The use of marriage data to measure the social order in nineteenth-century Britain. Sociological Research Online, 3(1), U43-U54. Lambert: BHPS conf July 2009
References • Archer, M. S. (2007). Making Our Way Through the World: Human Reflexivity and Social Mobility. Cambridge: Cambridge University Press. • Blossfeld, H. P., Mills, M., & Bernardi, F. (Eds.). (2006). Globalization, Uncertainty and Men's Careers: An International Comparison. Cheltenham: Edward Elgar. • Bottero, W., Lambert, P. S., Prandy, K., & McTaggart, S. (2009). Occupational Structures: The Stratification Space of Social Interaction. In K. Robson & C. Sanders (Eds.), Quantifying Theory: Pierre Bourdieu (pp. 141-150). Amsterdam: Springer Netherlands. • Burrows, R., & Crow, G. (2006). Geodemographics, Software and Class. Sociology, 40(5), 793-812. • Coxon, A. P. M., & Jones, C. L. (1978). The Images of Occupational Prestige: A Study in Social Cognition. London: MacMillan Press. • Devine, F. (2004). Class Practices: How parents help their children get good jobs. Cambridge: Cambridge University Press. • Erikson, R. (1984). Social Class of Men, Women and Families. Sociology, 18(4), 500-514. • Goblot, E. (1961). Class and Occupation. In T. Parsons (Ed.), Theories of Society. New York: Free Press. • Gordon, D., Pantazis, C., & Townsend, P. (2000). Absolute and overall poverty: A European history and proposal for measurement. In D. Gordon & P. Townsend (Eds.), Breadline Europe : The measurement of poverty (pp. 79-106). Bristol: The Policy Press. • Gordon, D. (2006). The concept and measurement of poverty. In C. Pantazis, D. Gordon & R. Levitas (Eds.), Poverty and Social Exclusion in Britain: The Millenium Survey. Bristol: The Policy Press. • Guveli, A., Need, A., & De Graaf, N. D. (2007). Socio-political, cultural and economic preferences and behaviour of the social and cultural specialists and the technocrats. Social class or education? . Social Indicators Research, 81(3), 597-631. • Hughes, E. C. (1958). Men and their Work. Glencoe, Ill.: Free Press. • Lambert, P. S., Tan, K. L. L., Turner, K. J., Gayle, V., Prandy, K., & Sinnott, R. O. (2007). Data Curation Standards and Social Science Occupational Information Resources. International Journal of Digital Curation, 2(1), 73-91. • McGovern, P., Hill, S., Mills, C., & White, M. (2007). Market, Class and Employment. Oxford: Oxford University Press. • Pettinger, L., Parry, J., Taylor, R., & Glucksmann, M. (Eds.). (2005). A New Sociology of Work? London:: Blackwell. • Stewart, A., Prandy, K., & Blackburn, R. M. (1980). Social Stratification and Occupations. London: MacMillan. • Tsakloglou, P., & Papadopoulos, F. (2003). Poverty, material deprivation and multi-dimensional disadvantage during four life stages: Evidence from the ECHP. In M. Barnes, C. Heady, S. Middleton, J. Millar, F. Papadopoulos, G. Room & P. Tsakloglou (Eds.), Poverty and Social Exclusion in Europe. Cheltenham: Edward Elgar. • Waldinger, R., & Lichter, M. I. (2003). How the Other Half Works: Immigration and the Social Organization of Labor. Berkeley: University of California Press. • Weeden, K. A., & Grusky, D. B. (2005). The Case for a New Class Map. American Journal of Sociology, 111(1), 141-212.