Download

1 / 53
530 likes | 626 Views
This study presents a new statistical procedure to evaluate the effectiveness of measurement systems for Attribute Quality Data, analyzing factors influencing classifier accuracy and precision. It covers the Classification Matrix, Loss Matrix, and sorting probability rates, offering insights into improving sorting procedures. Various precision metrics and levels of quality data are discussed, along with Traditional accuracy metrics for binomial situations. The proposed method considers incoming product quality, sorting errors rates, and organizational charges, providing expected loss and effectiveness measures.

E N D
Effectiveness of a Product Quality Classifier Dr. E. Bashkansky, Dr. S. Dror, Dr. R. Ravid Industrial Eng. & Management,ORT Braude College, Karmiel, Israel Dr. P. Grabov A.L.D. Ltd., Beit Dagan 50200, Israel
“Effectiveness” - definition • Extent to which planned activities are realized and planned results achieved (ISO 9000:2000) • The state of having produced a decided upon or desired effect (ASQ Glossary, 2006).
Presentation Outline • Objective • Background • Basic definitions • Proposed approach to effectiveness evaluation • Measures resulting from proposed approach • The basic of repeated sorting • Case A – two raters • Case B – two raters + supervisor • Illustrative example and conclusions • Summary
Objective Developing a new statistical procedure for evaluating the effectiveness of measurement systems applicable to Attribute Quality Data based on the Taguchi approach.
Objective(cont.) When the loss incurred by quality sort misclassifying is large, an improvement of the sorting procedures can be achieved by the help of repeated classifications. The way it influences the classifying effectiveness is also analyzed.
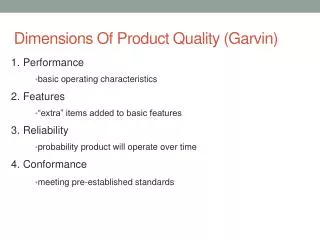
Accuracy and Precision. Accuracy The closeness of agreement between the result of measurement and the true (reference) value of the product being sorted. Precision Estimate of both the variation in repeated measurements obtained under the same conditions (Repeatability) and the variation of repeated measurements obtained under different conditions (Reproducibility).
The most popular precision metrics • Signal to Noise (S/N) ratio - compares the variations among products to variations in the MS • Precision to Tolerance (P/T) ratio - compares the latter to tolerance.
Four types of quality data • The four levels were proposed by Stanley Smith Stevens in his 1946 article. Different mathematical operations on variables are possible, depending on the level at which a variable is measured.
Categorical Variables 1. Nominal scale: Supplier: A,B,C…. Possible operations:
Categorical Variables(cont.) 2.Ordinal scale : • customer satisfaction grade , • quality sort, • customer importance (QFD) • vendor’s priority, • severity of failure or RPN (FMECA), • the power of linkage (QFD) Possible operations:
Numeric data. 3. Interval scale: Image Quality Possible operations:
Numeric data (cont.) 4. Ratio scale: • Amount of defectives in a batch • Deviation from a specification Possible operations:
Two types of data characterizing product/process quality Variables (results of measurement, Interval or Ratio Scales) Attributes(results of testing, Nominal or Ordinal Scales ).
Traditional accuracy metrics for binomial situation Accuracy is characterized by: • Type I Errors (non-defective is reported as defective) –alfa risk • Type II Errors (defective is reported as non-defective) –beta risk
Case Study (nectarines sorting) Type 1- 0.860, Type 2 - 0.098 , Type 3 -0.042
Introduction The proposed method takes into account the information available about: 1.Incoming product quality sort distribution, 2. Sorting errors rates, 3. Losses due to misclassification, 4. Additional organizational charges.
Basic definitions:1. Incoming and outgoing quality sort distributions pi - the probability that an item whose quality is to be classified has a quality level i qj - the probability that an outgoing item was classified as belonging to quality levelj
Basic Definitions:2. Sorting Probability Rates Sorting matrix: The sorting matrix is an 'm by m' matrix. Its components Pi,jare the conditional probabilities that an item will be classified as quality levelj, given its quality level is i.
Cheating (4) Absence of any sorting
Three Interesting Sorting Matrices • (a) The most exact sorting: • (b) The uniform sorting: (designated as MDS: most disordered sorting): • (c) The “worst case” sorting. For example, if m = 4:
Loss Matrix Let Lij - be the loss incurred by classifying sort i as sort j.
Losses due to misclassification Loss matrix (in NIS/kg) :
Additional Organizational Charges A - the cost (per product unit) concerned with one additional rating. B - all expenditures (per product unit) concerned with the supervisor control.
The Proposed Measures Expected Loss Definition: Effectiveness Measure: For exact sorting Eff= 1, for MDSEff= 0
Measures resulting from proposed approach when:1. Only information about the sorting matrix is available • Hequals 1 for the exact sorting • Hequals 0 for the random sorting
Measures resulting from proposed approach when:2. Information about the sorting matrix and the incoming quality is available 2.1 Uncertainty reduction measure • Uequals 1 for the exact sorting • Uequals 0 for the random sorting
Measures resulting from proposed approach:2. Information about the sorting matrix and the incoming quality is available 2.2 Modified kappa measure • Gequals 1 for the most exact sorting • Gequals 0 for the most disordered sorting
REPEATED (REDUNDANT) SORTINGCase A: Two Independent (but correlated) Repeated Ratings Assumptions: 1. - conditional joint probability of sorting i by the first rater, and j by the second, given the actual sort – k. 2. The same capabilities for both stages/raters, 3. In the case of disagreement, the final decision is made in favor of the inferior sort (one rater can see a defect, which the other has not detected).
REPEATED (REDUNDANT) SORTINGCase A: Two Independent Repeated Ratings Results: 1. Redistributionofprobabilities: The probability of making a true decision about low quality products increases, while the probability of making a true decision about high quality products decreases. 2. To verify improvement in sorting effectiveness, we need a new expenditure calculation: ( A is the cost (per product unit) concerned with the additional rating ).
REPEATED (REDUNDANT) SORTINGCase B: Three Repeated Ratings Assumptions: 1. The same capabilities for the first two stages/raters, 2. A third rater is added only if the first two raters do not agree. 3. His/her decision could be considered as an etalon measurement.
REPEATED (REDUNDANT) SORTINGCase B: Three Repeated Ratings Results : 1. The probability of correct decisions, increases, and the probability of wrong decisions, decreases. 2. The probability of having to carry out the etalon measurement is important. 3. The total expenditure concerning the triple procedure has to be calculated.
ILLUSTRATIVE EXAMPLE Consider a sorting line that classifies fruits into the three levels of quality: 1. High 2. Medium, 3. Unacceptable. The proportions of the above types are: Type 1 - 53 %, Type 2 - 27 %, Type 3 - 20 %.
Losses due to misclassification Loss matrix (in NIS/kg) :
The joint probability matrices for two repeated ratings • -k indicates the quality level of the product • i represent the first rater’s decision and j the second rater’s decision. • The probability of disagreement equals 0.1776:
Conclusions Concerning Case A • The probability of making a true decision concerning low quality products increases while the probability of making a true decision concerning good quality products decreases. • All measures that do not take into account the real losses of misclassification (H, U, kappa, G ) do not differ significantly. • Applying the two raters method is expedient, if the cost of additional rating does not exceed: EL - EL' = 0.534 - 0.309 = 0.225 (NIS/kg).
Conclusions Concerning Case B • Accuracy of classification is much better, if all items on which there is no agreement are passed to the supervisor. It reflects in improvement of all metrological parameters. • Nevertheless, to decide whether applying this method is expedient or not, the cost of the third additional rating multiplied by the probability that it will be required should not exceed EL' - EL'' = 0.309 – 0.132 = 0.177 (NIS/kg) or ,in other words, this cost should not exceed one NIS/kg.
Summary - 1 The proposed procedure for evaluation of product quality classifiers takes into account some a priori knowledge about the incoming product, errors of sorting and losses due to under/over graduation.
Summary - 2 It is shown that when the loss function - the major component of the proposed measure - is chosen appropriately, we arrive at already known measures for quality classification as well as to some new measures.
Summary - 3 The appropriate choice of the loss function matrix provides the opportunity to fit quality sorting process model to the real situation.
Summary - 4 Repeated sorting procedures could be expedient for cases when the loss incurred by quality sort misclassifying is large.