Download
1 / 15
340 likes | 787 Views
Financial Ratio Analysis. INTRODUCTION. Financial ratio analysis is a tool used to conduct a quantitative analysis of information in a company’s financial statement.

E N D
INTRODUCTION • Financial ratio analysis is a tool used to conduct a quantitative analysis of information in a company’s financial statement. • Ratios are calculated from current year numbers and then compared to previous years, other companies, the industry or even the economy to judge the performance of the company. • As a BENCHMARKING tool.
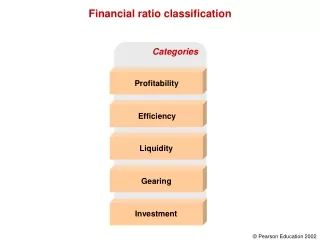
USERS OF RATIO • There are vast number of parties interested in analysing financial statements, including shareholders, lenders, customers, suppliers, employees, government agencies and competitors. Yet, in many respects, they will be interested in different things. • Ratio analysis is a first step in assessing an entity. • The table below shows some categories of ratios and indicates some of the stakeholder groups that would be interested in them:
. .
CATEGORIES OF RATIO Profitability Ratios • Return on capital employed (ROCE) • One of the most important profitability ratios, as it encompasses all the other ratios, and because an adequate return on capital employed is why people invest their money in a business at the first place. • We will look further from both perspectives of sole traders and companies. • Sole trader • We will use average of the capital account as the figure for capital employed, calculated as (op. bal. + cl. bal.) / 2 • Example: business C and D have made the same amount of net profit, but the capitals employed are different.
. BALANCE SHEET Business C Business D RM RM Fixed+CA-CL 100,000 100,000 Capital Accounts Op Bal 80,000 140,000 Add Net profit 36,00036,000 116,000 176,000 Less Drawings (16,000)(16,000) 100,000160,000 Therefore, Business C Business D 36,000 x 100 =40% 36,000 x 100 = 24% (80,000+100,000)/2 (140,000+160,000)/2 The ratio illustrates that what is important is not simply how much profit has been made but how well the capital has employed. Business C has made far better use of its capital, achieving of RM40 net profit for every RM100 invested, whereas D has received only a net profit of RM24 per RM100.
b) Companies • The main ones used for: • Return on capital employed sourced from ordinary shareholders • In a company, this is known as Return on Owner’s Equity (ROOE), or more commonly Return on Shareholders’ Funds (ROSF). • “return” = Net profit for the period. • “shareholders’ funds” = book value of all things in the balance sheet that describe the owners’ capital and reserves. • Return of capital employed sourced from all long-term suppliers of capital • Known as ROCE • “return” = net profit + any preference share dividends + debenture and long term loan interest. • “capital” = Ordinary Share Capital + Reserves including Profit and Loss account + preference share dividends + debenture and long term loan interest.
. Balance Sheet as at 31 Dec P Ltd Q Ltd RM RM RM RM 2007 2008 2007 2008 Fixed assets 520,000 560,000 840,000 930,000 Net Current assets 280,000340,000160,000270,000 800,000 900,000 1,000,000 1,200,000 10% Debentures - - (120,000)(120,000) 800,000 900,000 880,000 1,080,000 Share Capital (ord.) 300,000 300,000 500,000 500,000 Reserves 500,000600,000380,000580,000 800,000 900,000 880,000 1,080,000
. Profit and Loss Accounts for year to 31 Dec 2008 P Ltd Q Ltd RM RM Net Profit 220,000 380,000 Dividends (120,000) (180,000) 100,000 200,000 • ROSF P Ltd Q Ltd 220,000 x 100 = 25.9% 380,000 x 100 = 38.8% (800,000+900,000)/2 (880,000+1,080,000)/2 • ROCE P Ltd (note 1) Q Ltd (note 2) Same as ROSF = 25.9% 380,000+12,000 x 100 = 35.6% (1,000,000+1,200,000)/2 note 1: The return on capital employed by all long-term sources of capital (in Q Ltd’s case, the shareholders’ funds and the debentures) is the same as the ROSF in the case of P Ltd, as it has no debentures) Note 2: The debenture interest )i.e. 10% of RM120,000 = RM12,000) must be added back, as it was an expense in calculating the RM380,000 net profit.
. Gross Profit x 100 Sales 2) Gross Profit as percentage of sales 3) Net Profit as percentage of sales Net Profit x 100 Sales
. Liquidity ratios • In a business, profitability is not the only thing that is desirable. Accounting is used, not just to calculate profitability, but also to provide the information that indicates whether or not the business will be able to pay its creditors, expenses, loans falling due, etc. at the right time. • Being able to pay one’s debts as they fall due is known as being ‘liquid’. • When it comes to the liquidity of a business, both its own ability to pay its debts when due and the ability of its debtors to pay the amount they owe to the business are very important. • Ratio analysis that focuses upon liquidity (or solvency) of a business are current ratio and acid test ratio
. Acid test ratio = Current Assets - Stock Current Liabilities • Current Ratio • Compares assets which will become liquid within approximately twelve months with liabilities which will be due for payment in the same period and is intended to indicate whether there are sufficient short term assets to meet short term liabilities. • When calculated, the ratio may be expressed as: • A ratio to 1, with current liabilities being set to 1 , or • As a ‘number of times’, representing the relative size of the amount of total current assets compared with total current liabilities • You need to contextualise every ratio you calculate when you are trying to understand what the result means, such as: • What is the norm in this industrial sector (for example, retailers are often below 1:1) • Is this company significantly above or below that norm? • If so, can this be justified after an analysis of the nature of these assets and liabilities, and of the reasons for the amounts of each held? 2) Acid test ratio • This shows that, provided creditors and debtors are paid at approximately the same time, a view might be made as to whether the business has sufficient liquid resources to meet its current liabilities. • Stock is omitted as it is considered to be relatively illiquid, because it depends upon prevailing and future market forces and may be impossible to convert to cash in a relatively short time. • Example: E Ltd F Ltd Note: Sales for both E and F amounted to RM144,000. GP for E and F were identical at RM48,000 Current ratio = Current Assets Current Liabilities
. • Profitability is the same for both businesses. However, there is a vast difference in the liquidity for the two businesses. • Current ratios : E = 90,000 = 3 F= 60,000 = 2 30,000 30,000 this looks adequate on the face of it, but let’s look at the acid test ratio: • Acid test ratios: E = 60,000 = 2 F = 10,000 = 0.33 30,000 30,000 • This reveals that F may be in trouble, as it will probably find it difficult to pay its current liabilities on time. • No matter how profitable a business is, unless it is adequately liquid it may fail. • However, it is also not very healthy to have too high ratio; ie. Too many resources being held as current assets – could have been used for more profitability. Efficiency Ratios • Stock turnover • Measured how efficient a business is at maintaining an appropriate level of stock. • When it is not being as efficient as it used to be, or is being less efficient than its competitors, this may indicate that control over stock levels is being undermined. E = 96,000 F = 96,000 (34,000+30,000)/2 (46,000+50,000)/2 = 96,000 = 96,000 32,000 48,000 = 3 times = 2 times • Debtor/Sales ratio E = 45,000/144,000 F = 9,000/144,000 = 1 : 3.2 = 1 : 16 • The relationship between debtor and sales is often translated into the length of time a debtor takes to pay Stock turnover= Cost of Sales Average Stock Debtors Sales
. Creditors Purchases E = 365 x 1 = 114 days 3.2 F = 365 x 1 = 22.8 days 16 • Why company E should have allowed so much time for its debtors to pay is a matter for investigation. i.e. hard to sell the products, thus giving longer credit term to customer. Or it could be that E has no proper credit control system, whereas F has an efficient one. • When the ratio is rising, this may signal liquidity problems. 3) Creditor/purchases ratio • Assuming that purchases for E amounted to RM92,000 and for F RM100,000 then the creditor/purchases ratio can be calculated as: E = 30,000 = 1:3.07 F = 30,000 = 1:3.3 92,000 100,000 • This also is often translated into length of time we take to pay our creditors. E = 365 x 1 = 118.9 days 3.07 F = 365 x 1 = 110.6 days 3.3
. Div. yield= Market price per share EPS Shareholders’ Ratios • ‘price’ = price of the shares on the Stock Exchange • Earnings per share (EPS) • This gives the shareholder a chance to compare one year’s earnings with another. Many people consider EPS to be the most important ratio that can be calculated from the financial statements. 2) Price/Earnings ratio (P/E ratio) • This puts the price into context as multiple the earnings. The greater the P/E ratio, the greater the demand for the shares. 3) Dividend yield • This measures the real rate of return by comparing the dividend paid to the market price of a share. 4) Dividend cover • This gives the shareholder some idea as to the proportion that the ordinary dividends bear to the amount available for distribution to ordinary shareholders. EPS= Net Profit aft. Interest and tax and preference dividend No. of ordinary shares issued Div. Cover= NP aft. Tax and preference dividends Ordinary dividends paid and proposed P/E ratio= Market price per share EPS