Download
1 / 22
220 likes | 391 Views
MODIS Regional and Global Cloud Variability. Brent C. Maddux 1,2 Steve Platnick 3 , Steven A. Ackerman 1,2 , Paul Menzel 1 , Kathy Strabala 1 , Richard Frey 1 1 Cooperative Institute for Meteorological Satellite Studies 2 Department of Atmospheric and Oceanic Sciences-U of Wisconsin

E N D
MODIS Regional and Global Cloud Variability Brent C. Maddux1,2 Steve Platnick3 , Steven A. Ackerman1,2, Paul Menzel1, Kathy Strabala1, Richard Frey1 1Cooperative Institute for Meteorological Satellite Studies 2Department of Atmospheric and Oceanic Sciences-U of Wisconsin 3NASA Goddard Space Flight Center, Greenbelt, Maryland 7th CoRP Science Symposium, Fort Collins, CO, August 11, 2010
Overview CF and CTP Big Picture - Trend? - Aqua/Terra difference MODIS Case Studies - View Angle - Surface Type - Other Cloud Fractions from MODIS? - Averaging games
CTP Aqua Nighttime Global Means • Collection 5 Data • 36 spectral bands • 10:30 am/pm Terra • 1:30 am/pm Aqua • CTP: • 4 CO2 bands plus 10μm • Biggest differences are over land-deep daytime convection CTP Aqua Daytime 200 375 550 725 900
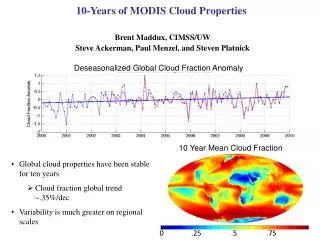
CF Aqua 7 Year Mean Global Means • Daytime cloud fraction • Coast lines evident • Differences where expected: maritime stratocumulus decks, SH land, etc. CF Terra 9 Year Mean 0 .25 .5 .75 1.0
CF daytime decadal change .35% • Trend is not significant • Would need a 14 year record with this trend • If pre-2003 data is removed no trend at all • Aqua and Terra agree very well Terra until recently was slightly higher than Aqua
Daily Zonal Hovmoller: Terra Daytime Cloud Top Pressure Anomaly -100 0 100 hPa
Cloud Fraction Day Difference for 7 yrs (Aqua minus Terra) -.3 0 .3 FEB JAN MAR MAY APR JUN AUG JUL SEP NOV OCT DEC
0 .25 0.5 .75 1.0 View Angle BiasesSingle Day in the MODIS Orbit • Geostationary-like view • 16 day orbit procession • U-Shape at edges of convection and cloudy regions • See through holes in clouds or through thin high clouds near nadir • Most other data sets show similar characteristics Terra Daytime Cloud Fraction
Nadir to 10° Nadir to 10° minus 60 and greater 60° to edge of scan° Daytime Cloud Fraction Mean • Differences not uniform • Largest differences not where thin high clouds exist
Cloud Fraction vs Viewing Angle • 7 years of Aqua and Terra • 16% increase from near nadir to edge of scan • View angle effect not constant for all cloud types Cloud Fraction (%) Cloud Fraction vs Sensor Zenith Angle Sensor Zenith Angle
Near Nadir Near Edge of Scan Cloud Fraction (%) Nadir vs Edge of Scan • Changes are not uniform • Largest changes in CF aren’t the same as largest changes in optical properties Cloud Top Pressure (hPa) 200 375 550 775 900 0 0.2 0.4 0.6 0.8 1 Cloud Effective Radius Ice (μm) Cloud Effective Radius Liquid (μm) Cloud Optical Depth Ice 5 10 15 20 25 5 10 15 20 25 15 20 25 30 35 15 20 25 30 35 Cloud Optical Depth Liquid Maddux, B. C., S. A. Ackerman, and S. Platnick, 2010: View Geometry Dependencies in MODIS Cloud Products, J. Tech A, Accepted.
Cloud Fraction Difference Due to Sensor Zenith Angle Cloud Fraction Difference Day of year Cloud Fraction Mean for High (Red) and Low (Blue) Sensor Zenith Angle Mean Cloud Fraction Day of year
Active vs. PassiveSurface Type • MODIS vs Calipso for 2-years of data over Arctic Liu, Y., S. Ackerman, B. Maddux, J. Key, and R. Frey, 2010: Errors in cloud detection over the Arctic using a satellite imager and implications for observing feedback mechanisms, J. Climate, 23(7), 1894-1907.
Day MODIS Calipso MODIS-Calipso Active vs. Passive • MODIS vs Calipso for 2-years of data over Arctic • Large bias at night over ice assuming Calipso is truth • 21% error in CF translates to a trend error of 2.6%/decade Night MODIS Calipso MODIS-Calipso
Cloud Fraction Retrieval Fraction Who sees a cloud? • Comparison to other cloud datasets (apples-to-apples) • Place ‘error bars’ on global mean statistics • Quantify cloud variability globally Absolute Difference Anomaly Difference
Mean Cloud Fraction Difference (MOD35-MOD06) 0 10 20 30 40 (%) MOD06 cloud fraction is a quality assured subset of MOD35 to retrieve better cloud optical properties
Mean Cloud Fraction Difference in Percent (MOD35-MOD06)/MOD35 0 30 60 (%) Differences are due to the QA stuff (clear sky restoral and cloud edges, thin clouds, and surfaces influences).
CTP (red,all cloud) and CTP (blue, retrieval) histogram Pressure Level (hPa) % of Clouds at Pressure Level COD, Re, and WP are blue CTP and CF are red
Grid Cell Size and Swath Overlap More mid level cloud at high latitudes But temporal averaging puts high and low clouds together from multiple swaths 50 40 30 Cloud Fraction 20 10 EQ 15 30 45 60 75 90 Latitudes Included
Grid Cell Size and Swath Overlap Cloud Top Pressure Histogram 21% of mid level clouds in a 1x1 degree grid cell are mid level clouds High Cloud <400 hPa Mid Cloud >400 and <700 hPa Low Cloud >700 hPa
Pixel vs Area Weighting • Not a uniform offset • Doesn’t change long term mean (.2%) • Polar regions oscillate opposite mid-latitudes MODIS Terra Cloud Fraction Area (Red) and Pixel (Blue)
Conclusions MODIS Annual Cycle: 2.1% Decadal Change: .35% Aqua Terra Difference: <2% Local Surface Type Biases: 40% Local View Angle Bias: 60% (globally ≈16% or 4%)