Download
1 / 47
480 likes | 620 Views
More than a Pretty Picture: How Landsat Images Are Made. Malaspina Glacier, Alaska. Colors in satellite images represent data about the Earth. Our understanding of light makes it possible for us

E N D
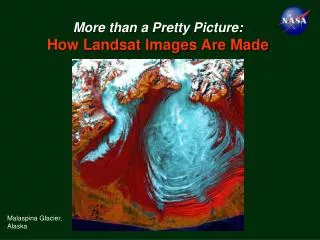
More than a Pretty Picture: How Landsat Images Are Made Malaspina Glacier, Alaska
Colors in satellite images represent data about the Earth. Our understanding of light makes it possible for us to design instruments that tell us stories about features and patterns on the Earth and in the atmosphere. Operational Land Imager, Landsat 8
Light is radiant energy: energy that radiates from its source.
Radiant energy is emitted by all objects above absolute zero (temperature).
We measure radiant energy in wavelengths, from crest to crest. Wavelength (a) is longer than wavelength (b)
Colors have different wavelengths. We see colors as different because they have different wavelengths. Red has the longest wavelengths of visible light, and blue/purple has the shortest wavelengths of visible light.
The whole electromagnetic (EM) spectrum consists of the longest and shortest wavelengths, and everything in between. People have grouped EM waves as radio waves, microwaves, infrared radiation, visible light, ultraviolet radiation, X-rays and gamma rays.
The light we see with our eyes alone is a very small partof the whole EM spectrum of radiant energy in the universe.
The Earth reflects EM radiation – light of different wavelengths. We can use our understanding of EM radiation to explore the Earth from space.
Our exploration of Earth from space can use wavelengths beyond the visible range. How?
First it helps to remember that – Sunlight strikes Earth’s surface. Some of it is absorbed, and some of it is reflected back into space. From: http://www.energyeducation.tx.gov/environment/section_3/topics/predicting_change/e.html
Sunlight interacts with objects, including trees and leaves. Some of the light is absorbed and some of it is reflected. Infrared, red, green, and blue light from the sun hit the tree (and leaf). Infrared and green light are reflected from the tree. Red and blue light are absorbed by the tree. IR = Infrared light R = Red light G = Green light B = Blue light
We see the tree as green, because wavelengths of light we call green are reflected to our eyes by the tree.
Wavelengths we see as green are about 525-550 nanometers (nm) in length. Wavelengths we see as red are 630-800 nm in length. The red petals of this poppy flower reflect strongly at wave-lengths of 700 nm.
Every kind of surface reflects light differently, absorbing and reflecting it weakly or strongly in different wavelengths.
Every kind of surface has its own spectral signature. Butter reflects weakly in blue and strongly in yellow to red. Tomato also reflects weakly in blue and strongly in red. red blue yellow
More spectral signatures. Notice how different kinds of surfaces reflect strongly or weakly (a lot or a little energy) at different wavelengths. (This graph uses micrometers rather than nanometers.)
A farmer using remote sensing can tell which sugar beet fields are healthy and which are not, if she/he knows their spectral signatures.
People measure the spectral signatures of different surfaces on the ground. Then when they look at the spectral signature of a surface in a satellite image, they can tell what kind of surface the satellite was looking at. Guy with hand-held spectrometer
Landsat satellites look at Earth’s surfaces from space (705 km altitude).
What’s Special About Landsat • Primary mission: to map Earth’s land surface • Data consistent since 1972 • 16 day repeat • 30-meter resolution • Data publicly available at no cost
Landsat satellites orbit the Earth at 705 km above the surface.
Landsat orbits from north-south, from pole to pole, as Earth turns under it.
Here’s the pathway of light used by Landsat: from Sun to ground, then reflected to relay stations and sent to computers for analysis.
Landsat 5 observes the Earth in 7 ranges (or bands) of the electromagnetic spectrum.
In this illustration of just one band of Landsat data, each square represents a 30m x 30m piece of land surface. Landsat has a spatial resolution of 30 m.
The Landsat instrument records the amount of reflected light in each band for each 30 m pixel, on a scale of 0 to 255. A numerical value of 0 represents no reflected light and a numerical value of 255 represents maximum reflected light. 0: See the corres-ponding black pixel in gray-scale array. 255: See the corresponding white pixel in gray-scale array.
Putting all the layers of data together (all 7 bands plus panchromatic band) amounts to a lot of data! There are 3.8 gigabits of data in one Landsat 7 scene.
Now – how do we make colorimages of all that grayscale data so we can understand and work with it more easily?
Remember, Landsat uses some bands of infrared light. The human eye is not sensitive to infrared light. To build an image with infrared data that we can see, we must represent that data with colors from the visible portion of the electromagnetic spectrum—red, green, and blue.
We have to assignColorsto represent Landsat bands (using computer software). Here’s an example. We’ve made the green band (green light, which is light in the 0.52 to 0.60 micrometer wavelength range, to appear red in our new image.
People can chose red, green, or blue to represent any of the wavelength ranges they like. One can make lots of color combinations. (This is Beverly, MA.)
1 2 3 4 7 5 6 Visible Infrared 3,2,1 Green Data is shown as Green Blue Data is shown as Blue Red Data is shown as Red
1 2 3 4 7 5 6 Visible Infrared 4,3,2 NIR Data is shown as Red Red Data is shown as Green Green Data is shown as Blue
Visible wavelengths Infrared wavelengths Making images with different band combinations, we see more than we could otherwise. Same scene, different wavelengths
True-Color Composite (3,2,1) True-color composite images approximate the range of vision for the human eye, and hence these images appear to be close to what we would expect to see in a normal photograph. True-color images tend to be low in contrast and somewhat hazy in appearance. This is because blue light is more susceptible than other bandwidths to scattering by the atmosphere. Broad-based analysis of underwater features and landcover are representative applications for true-color composites. Near Infrared Composite (4,3,2) Adding a near infrared (NIR) band and dropping the visible blue band creates a near infrared composite image. Vegetation in the NIR band is highly reflective due to chlorophyll, and an NIR composite vividly shows vegetation in various shades of red. Water appears dark, almost black, due to the absorption of energy in the visible red and NIR bands. Shortwave Infrared Composite (7,4,3 or 7,4,2) A shortwave infrared composite image is one that contains at least one shortwave infrared (SWIR) band. Reflectance in the SWIR region is due primarily to moisture content. SWIR bands are especially suited for camouflage detection, change detection, disturbed soils, soil type, and vegetation stress. Mount Rainier
Landsat 7, Path 35 Row 34, 09.12.00 True color 3,2,1
Near-infrared composite 4,3,2
What scientists & students can do with Landsat • Learn what’s behind Google Earth, and the power of data behind the imagery • Map, analyze, and predict urban growth and impervious surfaces • Monitor crop health • Monitor forest health • Measure deforestation and reforestation • Quantify amount of land used in surface mining • Track mountaintop removal • Determine the extent of flood zones for emergency response and assessment of insurance claims • Map extent and severity of forest fires • Monitor seasonal wetlands to help predict the spread of pest-borne diseases
Scientists can also – • Estimate amounts of carbon stockpiled in vegetation. • Quantify water use on specific farms and rangelands. • Improve forest inventories to predict tree growth and product yield. Scientists examine the fruits of a rainforest tree.
National Aeronautics and Space Administration http:www.nasa.gov