Download
1 / 1
10 likes | 118 Views
50. Modeling the impact of land cover change and water withdrawals on runoff and N retention in the Ipswich River, MA. 5. Runoff (mm/d). 0.5. 0.05. 0.005. National Science Foundation. University of New Hampshire. Water Systems Analysis Group. Long Term Ecological Research.

E N D
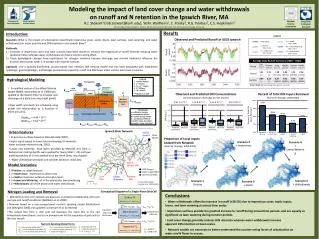
50 Modeling the impact of land cover change and water withdrawals on runoff and N retention in the Ipswich River, MA 5 Runoff (mm/d) 0.5 0.05 0.005 National Science Foundation University of New Hampshire Water Systems Analysis Group Long Term Ecological Research R.J. Stewart1 (rob.stewart@unh.edu), W.M. Wollheim1, C. Polsky2, R.G. Pontius2, C.S. Hopkinson3 (1) University of New Hampshire, Durham, NH, (2) Clark University, Worcester, MA, (3) University of Georgia, Athens, GA Results L • Introduction: • Question: What is the impact of urbanization (specifically impervious cover, septic inputs, lawn surfaces, lawn watering, and water withdrawals) on water quantity and DIN retention in the Ipswich River? • Rationale: • Increases in impervious cover and lawn surfaces have been shown to increase the magnitude of runoff (thereby reducing water residence times) whereas water withdrawals can have a counter-acting effect. • These hydrological changes have implications for nitrogen retention because discharge and channel hydraulics influence the duration that stream water is in contact with reactive surfaces. • Approach: Use a spatially-distributed, process-based river network DIN removal model that has been populated with established hydrologic, geomorphologic, and biologic parameters to quantify runoff and DIN fluxes under various land cover scenarios. Legend Observed and Predicted Runoff at USGS Ipswich 3.) + Septic (NS = 0.43) Observation 2001 2002 2000 2003 2004 2005 0 2 4 km 1.) Pristine (NS = 0.41) 4.) + Lawns/Watering (NS = 0.41) 2.) + Impervious (NS = 0.44) 5.) + Withdrawals (NS = 0.50) 50 5 Runoff (mm/d) 0.5 0.05 Hydrological Modeling Legend • Hamon method • γ * surplus • (1 – γ) * surplus • β * GWpool • Φ * Swpool • * Pellerin et al. 2007 Precipitation 0.005 Runoff depth (percent change from pristine scenario) Snowmelt *20% 80% ET • A modified version of the Water Balance • Model (WBM, Vörösmarty et al. 1998) was applied to the Ipswich River to simulate river discharge on a daily time-step [right panel]. Rstorm Snowpack Lawn ET Impervious Pervious Percent of Total DIN Inputs Removed (Summer Average, 2000-2004) 1. Wetland Detention Pool 3. 5. Rooting Zone (AWC) Rsurface Observed and Predicted DIN Concentrations (binned based on discharge at river mouth) 1 to 2 m3 s-1 2 to 3 m3 s-1 3 to 4 m3 s-1 0 to 1 m3 s-1 2. Septic • River width and depth are simulated using power law relationships as a function of mean annual Q: • DepthMC = 0.45 * Q0.17 • WidthMC = 9.56 * Q0.65 93.7% 4. Rgw Groundwater Detention Pool 6 Parameters γ = infiltration fraction β = groundwater release Φ = surface storage release Ω = soil drying coefficient Snowfall = temp. threshold Snowmelt = temp. threshold Percent of Total DIN Inputs Removed 82.0% 81.0% Rtotal = Rstorm + Rsurface + Rgw 77.4% DIN (mg L-1) 71.5% Observed Modeled (Scenario 5) Observed Modeled (Scenario 5) Observed Modeled (Scenario 5) Observed Modeled (Scenario 5) Urban Features Ipswich River Network USGS Gauges Water Supply Wdls. Commercial Wdls. Scenario 4 + Lawns/ Watering Scenario 2 + Impervious Scenario 3 + Septic Scenario 1 Pristine Ipswich River Network USGS Ipswich Scenario 5 + Wdls. River Mouth • Impervious surfaces based on MassGIS data (2007). • Septic inputs based on town data and average US domestic • water use (waterfootprint.org, 2001). • Lawns and watering: Data layers provided by MassGIS and Clark U. Reduced soil rooting depths were applied for lawns (AWC = 25) and lawn watering consists of 1 inch, applied once per week (June, July, August). • Water withdrawal schedules and volumes based on USGS data Proportion of Local Inputs Leaked from Network (Summer Average, 2000-2004) Scenario 2 + Impervious Scenario 4 + Lawns/Watering Model Scenarios: Salem – Beverly Wdl. 1.) Pristine: no urban features 2.) +Impervious: impervious surfaces only 3.) + Septic: imperious surfaces and septic inputs 4.) + Lawns and Watering: all of the above plus lawns/watering 5.) + Withdrawals: all of the above with water withdrawals Lynn Wdl. Peabody Wdl. USGS Middleton Scenario 5 + Withdrawals Scenario 1 Pristine Scenario 3 + Septic Zarriello 2002 (USGS) Archfield et al. 2009 (USGS) Nitrogen Loading and Removal Conceptual Diagram of a Single River Grid Cell Conclusions • DIN inputs to the river network are based on an empirical relationship with land use type and runoff conditions (Wollheim et al. 2008) • Removal based on a two-compartment nutrient spiraling model (Mulholland and DeAngelis 2000) and updated via Stewart et al. (In Review) • The output flux from a river grid cell becomes the input flux to the cell immediately downstream, and so on downstream for the sequence of grid cells to the river mouth • Water withdrawals offset the increase in runoff (+28.5%) due to impervious cover, septic inputs, • lawns, and lawn watering at annual time scales. • Impervious surfaces provide the greatest increase to runoff during annual time periods, and are equally as • significant as lawn watering during summer periods. • Land cover change generally reduces DIN retention whereas water withdrawals increase • apparent DIN retention at basin scales. • Network models are necessary to better understand the counter-acting forces of urbanization on • water and N fluxes to oceans. Surface TS RemovalSTS = 1 – exp (-ktτSTS) STS Transfer = (αSTS * AMC * L) / Q Upstream and Local DIN Inputs Main Channel RemovalMC = 1 – exp (-Vf/HL) Downstream DIN Flux HTS Transfer = (αHTS * AMC * L) / Q Hyporheic TS RemovalHTS = 1 – exp (-ktτHTS) Nutrient Spiraling Model Terms α = exchange rate [T-1] HL = hydraulic load [L T-1] τ = ATS / (α AMC) [T] kt = time specific uptake rate [T-1] AMC = cross sectional area of MC [L2] AHTS = cross sectional area of HTS [L2] ASTS = cross sectional area of STS [L2] Vf = nutrient uptake velocity [L T-1] L = grid cell length [L] kt = 0.64 d-1 Vf = 0.08 m d-1


![A [simple] land cover change intercomparison](https://cdn2.slideserve.com/3941152/a-simple-land-cover-change-intercomparison-dt.jpg)