Toxicity Testing II P erforming a toxicity test
310 likes | 745 Views
Toxicity Testing II P erforming a toxicity test. Toxicity testing. Acute toxicity test Short time frame exposure (96h) “kill ‘em and count ‘em” LC 50 , TLM (median tolerance limit EC 50 (effective concentration) Chronic toxicity test Longer time frame exposure (1 week to 3 years)

Toxicity Testing II P erforming a toxicity test
E N D
Presentation Transcript
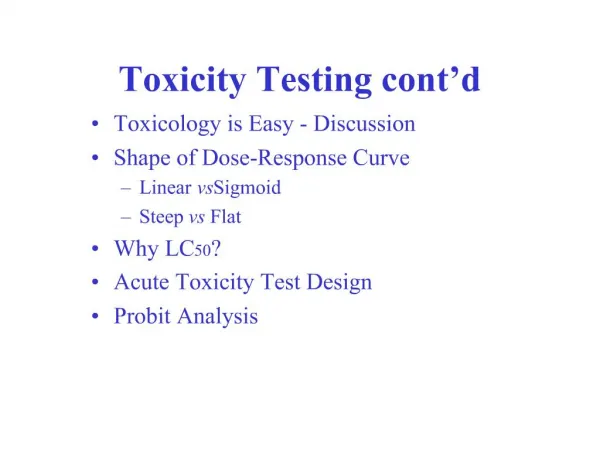
Toxicity testing Acute toxicity test • Short time frame exposure (96h) • “kill ‘em and count ‘em” • LC50, TLM (median tolerance limit • EC50 (effective concentration) Chronic toxicity test • Longer time frame exposure (1 week to 3 years) • Endpoints are reproduction (brood size) physiology, behavior, biochemistry • More ecologically relevant
Analysis • Analysis of Variance (hypothesis testing) • Test for significant difference from control (C + 5 doses) • Regression analysis • EC20 (concentration that causes 20% reduction relative to control)
Determination of EC20 Control response 10 μg Response (growth) 20% reduction relative to control 8 μg Control EC20 eg. 1 mg/L = discharge limit Dose
Ecosystem Tests(microcosms, mesocosms) • AOV design (4 reps X 3 treat., 3 rep X 4) • Time = 1 – 2 years • $106 /year • Endpoints are • Biomass • Diversity • Species richness • Etc.
Normal distribution # Responding Log Dose Dose Probit Analysis • Response of organisms to toxic chemicals = normal distribution • Cannot measure normal distribution directly because effect is cumulative, so graph as cumulative distribution Cumulative distribution
Log Dose • Difficult to evaluate a curved line • Conversion to a straight line would make evaluation easier Cumulative distribution # Responding
Relationship between normal distribution and standard deviations 34.13% Mean 13.6% 2.13% -2 -1 0 1 2 Standard deviations
Difficult to deal with SD (34.13, 13.6, etc) so rename SD to probits 34.13% Mean 13.6% 2.13% 3 4 5 6 7 Probits
Probits • Based on SD so each probit has a percentage attached to it • Mean response defined as probit = 5 so all probits are positive easier to visualize • Can use probit analysis to calculate LC50 because probit transformation will straighten the cumulative distribution line
Cumulative distribution Probit transformed # Responding Log Dose Log Dose • Cumulative distribution is curvilinear • Probit transformation straightens the cumulative distribution line • Easier to calculate LC50 50% response LC50
Note: probit forces data towards middle of distribution good because most organisms are “average” in their response
Aquatic toxicity testing Daphnia (water flea) “White rat of aquatic toxicity testing” Daphnia toxicity test
Example problem Dose% alive 0 mg/L (control) 100 1 100 3 90 10 30 30 20 100 0
If there is magic on earth, it is in water Photo by R. Grippo
Today’s laboratory exerciseAcute toxicity test – Daphnia pulex • Use neonates (<24 h old) • All females (parthenogenetic) • Class will break up into 3 groups of 2 • 1 person in group will calculate dilutions, other will select neonate Daphnia
Calculation of Dilutions • Have stock solutions at a given concentration (10 mg/L Zn, 1 mg/L Cu, 100% effluent) • Want to make 100 ml test solutions at correct concentrations • Use C1 V1 = C2 V2 10 mg/L changes 100 ml Where C1 = concentration of stock solution V1 = volume needed of stock solution for ea. concentration C2 = desired concentration of test solution V2 = final volume needed in test chamber
To make up solutions in cups • Put correct volume of toxicant into graduated cylinder • Add MH water to ~98-99 ml • Top off with squirt bottle of MH water (bottom of meniscus) • Pour into plastic cup • Start with lowest concentration 1st, work up to highest (why?) • Rinse graduated cylinder with MH water when done
To count out Daphnia • Work on light table, easier to see. • Arrange 6 small plastic sample cups. • Put 2-3 ml in each sample cup (large drop). • Suck up Daphnia from brood container (2-3 at a time, neonates only). • Express Daphnia into large drop. Note: take care to release Daphnia under water if just drop in may get caught in surface tension and die • Put 2-3 in 1st cup, 2-3 in next cup, until all cups have 10 random distribution will prevent putting all easiest to capture in 1st cup, next easiest all in 2nd cup, etc • After have 10 in ea. Cup and test chambers are ready, carefully lower cup into test chamber and release animals under water. • Record # dead/alive 24 and 48 hrs
Estimate LC50 • If have at least two partial kills use computer program • If one or less partial kills use probit paper