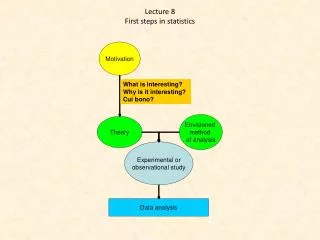
Analysis of Variance: Finding Differences in Means
180 likes | 228 Views
Understand the concept of ANOVA, its goal to find mean differences, sources of variance, hypotheses, assumptions, and application in SPSS. Learn about post-hoc tests, effect sizes, and alternatives to T-tests. Enhance statistical analysis skills.

Analysis of Variance: Finding Differences in Means
E N D
Presentation Transcript
Statistics in SPSSLecture 8 Petr Soukup, Charles University in Prague
What is it all about? Title : Analysis of variance BUT THE GOAL IS: to find difference in means (see next slide) ANOVA – ANalysis Of VAriance SPSS – many procedures
Basic idea IDEAL CASE B IDEAL CASE A BIG DIFFERENCE IN MEANS NO DIFFERENCE IN MEANS ? AND WHAT ABOUT VARIANCE ?
TWO SOURCES OF VARIANCE 1. WITHIN GROUP VARIANCE IDEAL CASE B IDEAL CASE A BIG WITHIN GROUP VARIANCE SMALL WITHIN GROUP VARIANCE ? AND WHAT ABOUT BETWEEN GROUP VARIANCE?
TWO SOURCES OF VARIANCE 2. BETWEEN GROUP VARIANCE IDEAL CASE B IDEAL CASE A x x x x x x NO BETWEEN GROUP VARIANCE BIG BETWEEN GROUP VARIANCE
BASIC IDEA IDEAL CASE B IDEAL CASE A SMALL BETWEEN G. VAR. BIG BETWEEN G. VAR. =? =? BIG WITHIN G. VAR. SMALL WITHIN G. VAR. RATIO FOR TWO SOURCES OF VARIANCE CAN BE USED FOR FINDING STATISTICAL SIGNIFICANT DIFFERENCE IN MEANS
ANOVA hypotheses H0: means for all groups are equal in the whole population H1: at least two groups are different in means in the whole population
Output from SPSS TEST Sources of variance
Data and sssumptions for ANOVA DATA: 1 cardinal variable (DEPENDENT) – e.g. income, satisfaction, lenght of education 1 variable that discriminnate into groups (FACTOR) – e.g. Level of edcuation, region, type of customer (Note: For two groups we use t-test) ASSUMPTIONS: Normality of dependent variable Equality of variances (Levene’stest), Independence of groups
ANOVA in SPSS Analyze»Compare Means»One-Way-Anova Outputs and comments Post-hoc tests - 2 types, logic of multiple testing and Bonferroni correction formulae Eta2 – effect size for ANOVA
Final notes More factors can be used two-,three-factors ANOVA In case of small samples use nonparametric alternative (K-W test)
HW7 Try to test difference in means (one cardinal variable) by ANOVA. Interpret results.