Download

1 / 24
600 likes | 1.57k Views
Statistics in SPSS Lecture 1. Petr Soukup, Charles University in Prague. Basic Info. Info. Teacher : Petr Soukup (Dep. of Sociology) Consultation hour : Tue , 14-14.30, Jinonice, 3065 Email: soukup @ fsv.cuni.cz Student ’ s introduction. Info.

E N D
Statistics in SPSSLecture 1 Petr Soukup, Charles University in Prague
Info • Teacher: Petr Soukup (Dep. of Sociology) • Consultation hour : Tue, 14-14.30, Jinonice, 3065 • Email: soukup@fsv.cuni.cz • Student’s introduction
Info Syllabus : see SIS(code JSM406)https://is.cuni.cz/studium/eng/predmety/index.php?do=predmet&kod=JSM406 Literature: Field, A. (2000). Discovering statistics using SPSS for Windows :advanced techniques for the beginner. London : Sage. 2006, 2009 editions (2nd or 3rd) Norušis,M., J. (2005).SPSS 13.0 :statistical procedures companion. New Jersey: Prentice Hall. Czech students: Mareš, Rabušic, Soukup. Analýza sociálněvědních dat (nejen) v SPSS. 2015. muniPRESS, Brno. (ch. 2 – ch. 10)
Requirements Grading will be based on homework assignments (8 mandatory assignments, each worth 5 points) and a final in-class exam (worth 60 points). Students may earn up to 100 total points. Final grades: 91 - 100 points = grade A 81 - 90 points = grade B 71 - 80 points = grade C 61 - 70 points = grade D 51 - 60 points = grade E < 50 points = not passed Note: It is expected that student is familiar with social science reseach (read some text about it or passed some course)
Main goal Introduction to social science statistics Introduction to SPSS environment Final: Students are able to analyze social science data for their purpose (e.g. preparation of thesis) More topics can be found in Advanced courses (IES and ISS at the Faculty)
Statistics Different meaning of the the expression Is it important? Why? Is it difficult ? Why? Is it boring?
Basic branches of statistics Descriptive stats Probability* Mathematical stats (Statistical inference) * nearly absent in the course (nice and small book: John Haigh: Probability – A very short Introduction, Oxford, 2012)
Special branches of statistics Sampling theory Time Series Analysis and many others
Basic concepts Variable Opposite of variable? Examples of variables?
Types of variables (different measurements) Nominal (NOMEN) Ordinal (ORDO) Cardinal (scale) Examples, discussion about coding schemes
Descriptive stats I Why we use descriptive stats? Different tools for individual types of variables
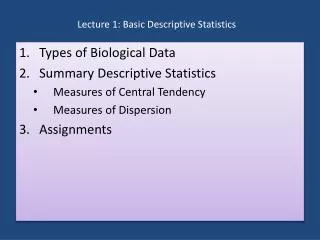
Descriptive stats II Central tendency (What is typical value?) Dispersion/Variance (Are there many differencies or not?) Distribution (Skewness and Kurtosis) – Is the distribution of values symmetric and with high peak or assymeric and flat? Pictures and examples
Central tendency Mode - nominal Median - ordinal Mean (Average) – cardinal Logic of statistical procedures according to type of variables Graphical presentation of mean and median (why mean is used so often?)
Statistical software What is statistical SW? General vs. Specialized Other tools for stats
General statistical software IBM SPSS Statistics (v. 25)http://www-01.ibm.com/software/analytics/spss/ Stata (v. 15) for universities, possibility to add do files http://www.stata.com/ SAS (v. 10) not only for stat, for professionals http://www.sas.com/en_us/home.html Statistica (v. 13) – very nice graphics http://www.statsoft.com/ R-project – the best and free (https://www.r-project.org/ )
Specialized statistical software usually for one procedure or for the family of close approaches E.g. AMOS from IBM for structural equation modelling (http://www-03.ibm.com/software/products/en/spss-amos)
Other tools for stat Mainly spreadsheets can do quite a lot from stats Excel – functions, Data analysis tool and many add-ins (free and commercial as well) Calc (from Open Office) – only functions (the same as in MS Excel) All stats in JSM406 can be computed via Excel or Calc (only outputs would not be so friendly and nice)
HW1 Try to describe three variables of different types, i.e. one nominal, one ordinal and one cardinal (scale) For nominal and ordinal variables define possible values (answers)