Download
1 / 16
160 likes | 200 Views
3DSLT reconstructs corona loops from STEREO images using triangulation. Select loops in images, trace segments and verify in 3D. Includes synthetic corona data set for magnetic field models.

E N D
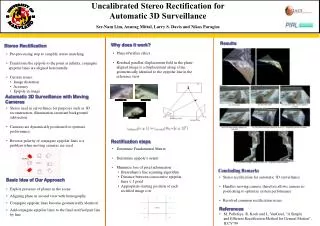
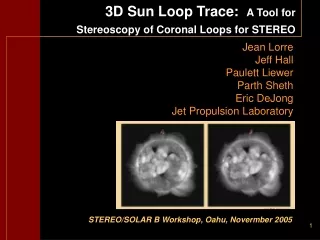
3D Sun Loop Trace: A Tool for Stereoscopy of Coronal Loops for STEREO Jean Lorre Jeff Hall Paulett Liewer Parth Sheth Eric DeJong Jet Propulsion Laboratory STEREO/SOLAR B Workshop, Oahu, Novermber 2005
3D Sun Loop Tracer - 3DSLT Tool for reconstruction of corona loops from STEREO image pairs using triangulation • Step 1 - User selects same loop in both images using cursor • Step 2 - Program traces loop segments separately in each image and performs 3D reconstruction using triangulation • Step 3 - Reconstructed loop plotted in 3D on solar sphere • User can rotate loop + sphere to verify loop reconstruction • Can also import field lines from potential field models, etc., for comparison • 3D coordinates of loop in heliographic coordinates also written to ascii file • Goal: Constrain extrapolated magnetic field models using reconstructed loops to determine pre-event energy stored in corona
Synthetic Corona Data Set Used synthetic corona data from Schrijver et al ( Ap J 2004) 360 views of the synthetic corona - 1º spacing 0º 15º 90º 45º Used different “pairs” to study reconstruction for different stereo separation angles
Step 1: Select the loop in both images User selects ‘seed’ points on the same loop in each image of the stereo pair using a cursor. pair with 15º separation Seed points can be anywhere on same loop segment Here we show 2 selected seed points - “up” and “down” segments of the loop selected separately
Step 2: Trace and Solve Run the SUNLOOP algorithm to trace loop segments in each image and run XYZSUN to solve for 3D solar coordinates of points along the loop. Loop coordinates are also written to an ascii file. Red segments show reconstructed loop displayed on each image of the original stereo pair
Step 3: Verify Results Display results from different viewpoints by rotating Sun in interactive viewer window (see demo). Red reconstructed loop segments are now compared to views not used in the reconstruction. For -45° and 90 °, reconstructed loop segments lie on the actual loop, verifying the reconstruction.
Sample Use: Compare Reconstructed Loops with Models • Reconstructed loop plotted in 3D on solar sphere • Can also import field lines from magnetic field models to constrain models • Nonlinear force-free fields (NLFFFs) can be computed from vector magnetograms (e.g. Solar B) • Right: Wiegelman’s model extrapolation overlaid on a TRACE image • Goal: Determine Free Energy Stored in Pre-CME Magnetic Configuration extrapolation courtesy of T. Wiegelmann
STEREO A at 22º STEREO B at -22º SOHO at 0º Tiepointing with 3 Eyes • SECCHI will use tiepointing & triangulation to determine 3D structure of loops • Reconstruction errors smaller with larger separation angles • But more difficult to identify same loop at larger separation angles • Third eye in the middle (Solar B or SOHO) will help identify same loop in STEREO A&B Synthetic coronal images from Schrijver et al
Red lines: successful automatic tracing & reconstruction from 6 initial tiepoints -22º +22º Tiepointing with 3 EyesResults from JPL Tiepointer Tool • Reconstruction from synthetic SECCHI views with 44° separation • Middle (Earth view) only used to help identify same loops • 6 Loop segments could be identified, traced & reconstructed Below: Side view of reconstructed loops used for verification
Summary • Developed tool for 3D reconstruction of loops from STEREO / SECCHI pairs • Uses automatic feature tracking to trace loop segments in each image • Limited to cases where the same loop can be identified in both images • Limited to vertically oriented features due to horizontal stereo ambiguity • Tested on SXT Virtual Corona dataset, courtesy K. Schrijver et al. • We find that it works over a broad range of separation angles of about 10 to 100 deg. • Now uses synthetic SECCHI data with fits headers • We are ready for other to start using it!
Backup 3D Sun Loop Tracer - 3DSLT
Synthetic EUVI Data Set with Fits Headers NEW: Using this data, created synthetic EUVI A&B data set with fits headers using SPICE ephemeris file Get some file names and images from CD 20080616104300peuB.fts DATE_OBS=‘2008-06-16T10:43:00.000’ 20080616104300peuA.fts DATE_OBS=‘2008-06-16T10:43:00.000’
Method for loop tracing Sunloop uses triangulation to the compute x,y,z coordinates (in the solar coordinate frame) and latitude & longitude information of a feature for a stereo image pair with known camera model. The following steps are performed in tracing a loop: 1. Beginning with the user's seed points, the program searches a small area to locate the best quality point centered upon the loop. It prefers bright filaments but can also be configured to follow bright edges and other linear features. 2. Local direction (orientation) of the loop is calculated. 3. It then searches again in the direction of the loop for the best next quality point, and computes the new direction. 4. If that point passes the tests it is added to the segment. If not then growth stops in this direction.
Results for Reconstruction Error Good stereoscopic reconstruction is possible over a wide range of separation angles Error vs. stereo angle for an equatorial loop (not shown) Error vs. stereo angle for polar loop (shown)
Method for finding 3D coordinates The following steps are performed in determining the 3-d coordinates of points on the loop: 1. The ray vector for each point in the left profile is compared with the ray vector for every point in the right profile to generate an error (the miss distance of the two vectors). 2. The right point with the smallest error is, with it's 2 neighbors, used to estimate the line where the vectors cross. We use a quadratic model which gives results good to about 1/10 pixel. 3. The sample value of this line is computed from a spline model of the right profile. 4. The left point and the new sub pixel right point construct vectors which cross at the solar xyz value of interest. 5. This cross point (the 3D location) is written to the output file.
STEREO Angular Separation Earth & STEREO spacecraft for separations of 10º and 100º