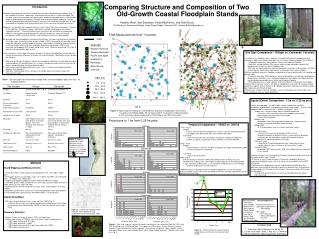
Comparative Analysis of Old-Growth Coastal Floodplain Forests: Kitlope vs. Carmanah
This study examines the structure and composition of two contrasting old-growth coastal floodplain stands in British Columbia, Kitlope and Carmanah. By analyzing data collected over a 15-year period, the research aims to understand the influences of site conditions, disturbance regimes, and climate on species composition and structural dynamics. The findings will aid in the development of management strategies for riparian ecosystems, ecosystem-based management, and restoration efforts, highlighting the variability and unique characteristics within these temperate rainforests.

Comparative Analysis of Old-Growth Coastal Floodplain Forests: Kitlope vs. Carmanah
E N D
Presentation Transcript
Comparing Structure and Composition of Two Old-Growth Coastal Floodplain Stands Kitlope Carmanah 45 45 22 22 20 20 40 40 CWD 18 18 Figure 1. Original distribution of North American coastal temperate rainforest(with permission, Ecotrustand Island Press) showing locations of Carmanah plot ( ) and Kitlopeplot ( ). 35 35 Heather West, Sari Saunders, Andy MacKinnon, and Todd DavisBC Ministry of Forests and Range, Coast Forest Region, Nanaimo, BC Heather.A.West@gov.bc.ca 16 16 30 30 14 14 25 25 SPECIES 12 12 10 10 20 20 (B) (A) 8 8 (A) 15 15 Western Hemlock (B) 6 6 10 10 4 4 Western Redcedar 5 5 2 2 0 0 0 0 0-10 0-10 Pacific crab apple 20-30 20-30 40-50 40-50 60-70 60-70 80-90 80-90 100-110 100-110 120-130 120-130 140-150 140-150 160-170 160-170 180-190 180-190 200-250 200-250 250-300 250-300 Amabilis Fir Red Alder Sitka Spruce Unknown DBH (cm) 0.0 - 20.5 20.6 – 49.9 50.0 – 89.9 90.0 – 149.9 150.0 – 295.0 100 m Figure 2. Digital maps of standing live and dead trees and coarse woody debris measured in 1 ha plots at (A) Kitlope (2008); (B) Carmanah (2007). Dashed lines indicate locations of 0.25 ha historical plots established in 1993 (Kitlope) and 1992 (Carmanah). Kitlope Trees 1993 Trees 2008 Trees/ha Carmanah Trees 1992 Trees 2007 Trees/ha Kitlope 10,919 Snags 2008 Snags1993 7213 4171 Snags/ha 200 150 Carmanah 100 Percent Change in Volume 50 Snags 2007 Snags1992 0 Snags/ha -50 Figure 3. scanned and compiled stand map from initial sketches during establishment of Carmanah plot, 1992 (0.25 ha); -100 • Field assistance: • Kaeli Stark • Jane Pendray • Rachel White • Molly Hudson • Sonya Powell • Liz Poulsom • Leah Ballin • Rachel Field • Ian Giesbrecht • Wendy Cocksedge -150 Acknowledgements -200 • Historical field measures and project establishment • Paul Alaback Diameter Class (cm) Diameter Class (cm) 1 2 3 4 5 total Figure 4. Trees and snags per hectare by species and diameter class calculated from the 1992-3 and 2007-8 overlap area, ~0.25 ha plot data. Tree species are Sitka spruce (Picea sitchensis), western hemlock (Tsuga heterophylla), western redcedar (Thuja plicata), amabilis fir (Abies amabilis), Pacific crab apple (Malus fusca), and red alder (Alnus rubra). Snags include “unknown”. Species colour codes as in Fig. 2. Decay Class • GIS support: • Anna Gerrard • Melissa Meneghetti • Dan Sirk • Introduction • Although coastal temperate rainforests of North America span a broad latitudinal gradient (Fig. 1), the variability of structure, composition, and function of these forests is poorly described. For example, recent remeasurements of high elevation, temperate old growth forests in Washington suggests understanding of dynamics is limited1 relative to low elevation, productive systems. Emergent properties demonstrated for coastal montane forests indicate the importance of study of competitive interactions and spatial pattern across scales for other old growth ecosystems2. • Floodplains are spatially and temporally dynamic systems within these forest landscapes. Variation in site conditions, disturbance regimes, and climate contribute to development of unique vegetation mosaics2. Characterization of these ecosystems will contribute to management initiatives such as representation planning for riparian management, ecosystem-based management (EBM), restoration activities, and evaluation of terrestrial carbon budgets. • We describe two spruce floodplains from contrasting latitudes, site types and disturbance conditions. The study stands are part of a larger project initiated in 1992-3 to quantitatively describe coastal temperate oldgrowth, evaluate temporal dynamics, and provide a baseline for measuring effects of climate change. Initially, overstory vegetation and coarse woody debris (CWD) were measured and mapped in 0.25 ha plots along the BC coast. We have remeasured (15 yr lag) all features and expanded the plots to 1 ha. • These summaries set the stage for analyses of spatial structure and composition that consider the relative and interactive influences of climate, site, and disturbance. Specifically, we will consider the following : • What role do site type, disturbance regime, and subregional (latitudinal) climatic differences play in driving patterns of (and differences in): (a) species composition and structure of overstory (b) species composition and structure of downed wood? • How and why would temporal differences (over 15 yrs) in structure and composition differ between these locations? • How does understanding of these influences on composition and structure change with measurement scale? Field Measurements from 1 ha plots • Site Type Comparison – Kitlope vs. Carmanah 1 ha plots • Variation across floodplain sites is apparent, associated with both microtopography and disturbance regime even though these plots are in the same broader ecological unit (CWHvm) • Kitlope plot experiences more frequent, intense, and expansive flooding • Both plots are dominated by Sitka spruce, which overtops deciduous species after approximately 50 years on mature floodplain sites3 • Both sites are highly productive indicated by overall size of trees (>90 m height, >2 m DBH) as well vigorous shrub layers (salmonberry in Carmanah, devil’s club in Kitlope) • Relative importance of wind vs. flooding is expected to influence spatial patterns of standing and downed wood • Carmanah soil profile, CWD abundance and size distribution, and understory development demonstrate a stand that is less frequently flooded than the Kitlope site; Kitlope stems/ha and distribution among dbh classes reflect more frequent flooding • Wind (gap-dynamics) is likely a greater structuring influence in Carmanah than Kitlope • Study of these nonmesic systems will allow for comparative assessment of resilience among disturbance regimes and site features and highlight ecosystems most prone to shifting structure and composition with climate change. • Relative roles of within-stand site conditions, such as heterogeneity of nutrient input, may impose additional scales of spatial patterning Table 1. Site characteristics measured for Kitlope and Carmanah floodplain plots (See Fig. 1 for mapped locations) • Spatial Extent Comparison - 1 ha vs. 0.25 ha plot • Within the expanded, 1 ha 2007-8 plots, species composition and DBH distributions tended to differ from projections based on the smaller (~0.25 ha) area (compare 2007-8 stand map, Fig. 2, to 2007-8 histograms, Fig. 4) • Kitlope trees- structure similar, species composition different • stems/ha similar; recruitment of western redcedar and red alder demonstrated from measurement of 1ha plot • similar DBH distribution • Kitlope snags • projections from 0.25 ha plot did not capture the smaller diameter recruits; i.e. red alder and Sitka spruce mortality • Kitlope CWD • 0.25 ha projections have less volume and fewer species • Carmanah trees • stems/ha 30% more than projected by 0.25 ha count • broader distribution of diameter classes in measured than projected • red alder was not captured by smaller plot; large plot captures opportunistic species growing in small gaps • Carmanah snags • snags/ha for 1ha plot and projected from smaller plot the same • species diversity seems to increase with measured 1 ha plot • Carmanah CWD • projected CWD volume/ha was 1890 m3/ha; 860 m3/ha was measured in the 1 ha plot • Dominant features are illustrated by 0.25 ha plot, but diversity and structure were only captured with larger 1ha plot • All species of trees, except hemlock in Carmanah, had patchy (positively associated) distributions across the 1 ha stand, not measurable from the 1992 0.25 ha plot • Patchy mosaic of biophysical resources and disturbance pattern over time determine a non-uniform distribution of species by diameter class that cannot be fully described in 0.25 ha plots for these forests. See also poster by SFU student Ian Giesbrecht. • To fully understand the drivers of structure and composition will require multi-scale study. Projections to 1 ha from 0.25 ha plots • Temporal Comparison – 1992/3 vs. 2007/8 • Trees (Fig. 4) • Kitlope • overal stems/ha decreased slightly over 15 years; western hemlock and pacific crab apple counts decreased; Sitka spruce counts decreased • Carmanah • stems/ha remained same, but species composition shifted with addition of amabilis fir; species (specifically, western hemlock) recruitment declined • Snags (Fig. 4) • Kitlope • overall decline in stems/ha; red alder and pacific crab apple not identified in 2008 • western hemlock new recruitment • Carmanah • stems/h remained same • CWD (Fig. 5) • Percent change in volume of CWD similar between plots for decay class 3-5 • No difference in decay class 1 for Kitlope; complete absence of new downed wood • Large recruitment of decay class 1-2 in Carmanah and decay class 2 in the Kitlope • potential evidence of recent disturbance • Additional efforts in tracking the fates of individual tagged trees, and in microscopic analysis of wood samples from snags and CWD will increase certainty regarding the fate of individual trees and snags • Methods • Stand Mapping and Measurements • Re-located 1992-3 (0.25 ha) plots and expanded these to 1-ha (100m X 100m) plots. • Re-mapped all trees (>5 cm DBH), snags (>5 cm DBH) and CWD (> 5 cm diameter and > 1 m length) in the 1992-3 plots • Mapped and tagged all additional features within the 2007/8 (1 ha) plots • Recorded species, height and DBH of trees and snags, diameter at both ends for all CWD, decay class for snags and CWD. • Recorded percent cover of all species of shrubs, herbs, and bryophytes in nested subplots • Examined substrate cover, humus form, and microtopographic relief, light conditions in associated projects (See poster by SFU MRM student – Ian Giesbrecht). • Digital Stand Maps • GIS layers for point features (trees, snags) and lines (CWD)(Fig. 2) • Locations derived from survey-generated bearings and distances to the feature from a georeferenced field location (2007/8) or from the historical sketch maps (Fig. 3) • Summary Statistics • Number of trees and snags by species, DBH, and height class • Numbers and volumes of CWD by species, diameter, length, and decay class: • 1992/3 data, measured 0.25 ha plot • 1992/3 data, projected 1 ha plot • 2007/8 data, measured 0.25 ha plot (intersection with 1992/3) • 2007/8 data, measured 1 ha • Literature Cited • Acker et al. 2006. Northwest Sci. 80: 65-72. • Larson and Franklin. 2006. J. Veg. Sci. 17: 489-498. • 3. Balian and Naiman. 2005. Ecosystems 8: 841-861. Figure 5 . Percent change in volume of coarse woody debris over 15 years for Carmanah and Kitlope.
(0,100) (100,100) 2007 plot 1992 plot (0,20) (0,0) (100,0) (0,20) (20,20) 2 m (5,5) (0,0) (20,0) 20 m 8 histograms below based on Overlap area Based on overlap area Based on complete data sets: 1992-3 and 2007-8 (A) Future Directions This poster presents preliminary analyses of some of our data from the Carmanah old growth plot. For this site, we still need to complete spatial analyses of our tree and snag data, and analyse coarse woody debris, vegetation, and light data. Over the next 3-5 years, we hope to relocate and sample the remaining 9 sites described in 1992-1993. Our intent is that this network of plots will be sampled every 10-15 years over the next 200 years. In 2008, we will remeasure 2 additional 1992 plots to obtain spatial structure and dynamics data. We are also beginning projects on: (1) gap dynamics, in which gaps will be permanently marked and photographed over time; (2) regeneration-structure-light relationships. These data on multiscale, spatial structure and composition in old-growth forests of western NA’s coastal temperate biome, will assist us in: (1) evaluating impacts of climate change; (2) implementing ecosystem-based management in coastal BC; (3) modeling forest dynamics; and (4) undertaking ecosystem restoration. (I Giesbrecht) Figure 2 – (A) Design for the 2007, 1 ha old growth plot incorporating the historical (1992) plot. Understory plots were established within each of 25, 20 x 20 m subplots, with hemispherical photos in opposite corners of each subplot; (B) spatial relationship of plots after relocation and remeasurement. 8 Histograms below based on complete 1992-3 and 2007-8 data sets Figure 5. Trees and snags per ha for 1 ha midbench floodplain plot at Carmanah established and measured in 1997. Species colour codes are as in Figure 3.