Download
1 / 7
110 likes | 324 Views
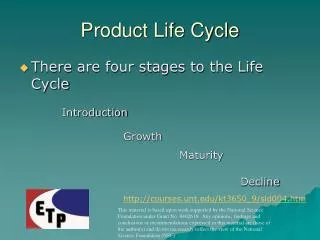
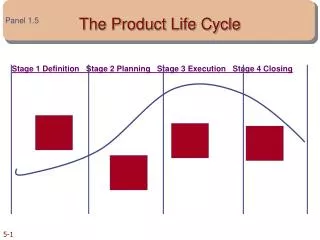
Stage 1 Definition Stage 2 Planning Stage 3 Execution Stage 4 Closing. The Product Life Cycle. Panel 1.5.

E N D
Stage 1 Definition Stage 2 Planning Stage 3 Execution Stage 4 Closing The Product Life Cycle Panel 1.5
Stage 1 Definition you look at the big picture—you state the problem, look at the assumptions and risks, identify the projects goals and objectives, and determine the budget and schedule Stage 2 Planning you consider the details needed to make the big picture happen—identify the facilities and equipment needed, people and their duties, and schedule and coordination efforts if needed Stage 3 Execution the actual work stage--you define management style and establish control tools—your main focus is to complete the project on time and under budget while trying to meet the client’s expectations Stage 4 Closing occurs when the project is accepted by the client—install deliverables and carry out training—may also have to write a report in which you document everything that has happened Product Live Cycle
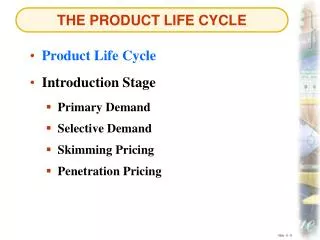
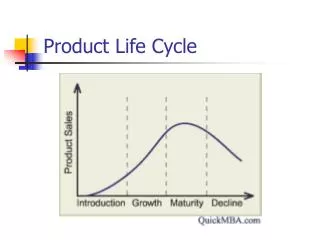
Market share leader enjoy a cost advantage relative to competitors because of extra learning & experience b’coz of producing additional output As the curve flattens, however it becomes increasingsingly difficulti to gain cost advantages from learning & experience staff Learning/Experience Curve
2 axis Unit Cost Total Cumullative Output Learning Curve
Break-Even Analysis Break-even analysis is a way of identifying how much revenue is needed to cover the total costs of developing and selling a product
Total Sales Revenue Profit Break-even point Costs/Revenues (in dollars) Total Costs Variable Costs Fixed Costs Break-even analysis Panel 5.6 $3,000,000 $2,400,00 $1,800,00 $1,200,000 $600,000 Loss 0 10,000 30,000 50,000 70,000 20,000 40,000 60,000 Sales Units (eg. of shirts and blouses)
For doing future “what-if” alternate scenarios of costs, prices, and sales For analyzing the profitability of past projects Benefits and Limitations of Break-even Analysis Benefits Break-even analysis has two benefits: Limitations Break-even analysis is not a cure-all: It oversimplifies The assumptions may be faulty