Download
1 / 63
740 likes | 1.43k Views
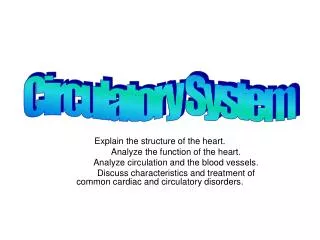
The cells of the heart. Two types of cardiac muscle cells that are involved in a normal heartbeat: Specialized muscle cells of the conducting system Contractile cells The heart is an autonomic system that can work without neural stimuli – an intrinsic conduction system.

E N D
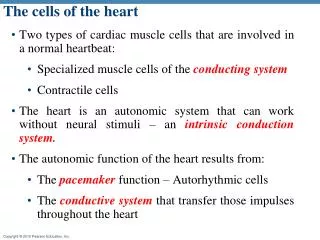
The cells of the heart • Two types of cardiac muscle cells that are involved in a normal heartbeat: • Specialized muscle cells of the conducting system • Contractile cells • The heart is an autonomic system that can work without neural stimuli – an intrinsic conduction system. • The autonomic function of the heart results from: • The pacemaker function – Autorhythmic cells • The conductive system that transfer those impulses throughout the heart
Properties of Cardiac Muscle • Aerobic muscle • No cell division after infancy - growth by hypertrophy • 99% contractile cells (for pumping) • 1% autorhythmiccells (set pace)
Electrical Conduction in Myocardial Cells Membrane potentialof autorhythmic cel Membrane potentialof contractile cell Cells ofSA node Contractile cell Intercalated diskwith gap junctions Depolarizations of autorhythmic cellsrapidly spread to adjacent contractilecells through gap junctions. Figure 14-17
Intrinsic cardiac conduction system – autorhythmic cells • Have unstable resting potentials/ pacemaker potentials • constantly depolarized slowly towards AP • At threshold, Ca2+ channels open • Ca2+ influx produces the rising phase of the action potential • Repolarization results from inactivation of Ca2+ channels and opening of voltage-gated K+ channels
Threshold Action potential 2 2 3 1 1 Pacemaker potential 3 2 1 Repolarization is due to Ca2+ channels inactivating and K+ channels opening. This allows K+ efflux, which brings the membrane potential back to its most negative voltage. Depolarization The action potential begins when the pacemaker potential reaches threshold. Depolarization is due to Ca2+ influx through Ca2+ channels. Pacemaker potential This slow depolarization is due to both opening of Na+ channels and closing of K+ channels. Notice that the membrane potential is never a flat line. Figure 18.13
Autorhythmic Cells Location Firing Rate at Rest SA node 70–80 APs/min* AV node 40–60 APs/min Bundle of His 20–40 APs/min Purkinje fibers 20–40 APs/min • Cardiac cells are linked by gap junctions • Fastest depolarizing cells control other cells • Fastest cells = pacemaker = set rate for rest of heart * action potentials per minute
Cardiac contractile cells • Depolarization opens voltage-gated fast Na+ channels in the sarcolemma • Depolarization wave causes release Ca2+that causes the cell contraction • Depolarization wave also opens slow Ca2+ channels in the sarcolemma • Ca2+ surge prolongs the depolarization phase (plateau)
Electrical Activity: Contractile Cell Figure 13.13
1 Action potential Depolarizationis due to Na+ influx through fast voltage-gated Na+ channels. A positive feedback cycle rapidly opens many Na+ channels, reversing the membrane potential. Channel inactivation ends this phase. Plateau 2 Tension development (contraction) Membrane potential (mV) 3 Tension (g) 1 2 Plateau phaseis due to Ca2+ influx through slow Ca2+channels. This keeps the cell depolarized because few K+channels are open. Absolute refractory period 3 Repolarizationis due to Ca2+ channels inactivating and K+ channels opening. This allows K+efflux, which brings the membrane potential back to its resting voltage. Time (ms) Figure 18.12
Action Potentials Table 14-3
Electrical Conduction in the Heart 1 SA node depolarizes. 1 SA node AV node Electrical activity goesrapidly to AV node viainternodal pathways. 2 2 Depolarization spreadsmore slowly acrossatria. Conduction slowsthrough AV node. 3 THE CONDUCTING SYSTEMOF THE HEART Depolarization movesrapidly through ventricularconducting system to theapex of the heart. 4 SA node 3 Internodalpathways Depolarization wavespreads upward fromthe apex. 5 AV node AV bundle 4 Bundlebranches Purkinjefibers 5 Figure 14-18, steps 1–5
Cardiac Cycle • Cardiac cycle - The period between the start of one heartbeat and the beginning of the next. • refers to all events associated with blood flow through the heart • During the cycle, each of the four chambers goes through • Systole – contraction of heart muscle • Diastole – relaxation of heart muscle • An average heart beat (HR)/cardiac cycle is 75 bpm. That means that a cardiac cycle length is about 0.8 second. • Of that 0.1 second is the atrial contraction, 0.3 is the atrial relaxation and ventricular contraction. • The remaining 0.4 seconds are called the quiescent period which represent the ventricular relaxation
Figure 18 Section 2 2 The sequence of events during a single heartbeat Relaxation Atria contract Relaxation Ventricles contract
Phases of the Cardiac Cycle • Ventricular filling — takes place in mid-to-late diastole • AV valves are open • 80% of blood passively flows into ventricles • Atrial systole occurs, delivering the remaining 20% • End diastolic volume (EDV): volume of blood in each ventricle at the end of ventricular diastole
Phases of the Cardiac Cycle • Ventricular systole • Atria relax and ventricles begin to contract • Rising ventricular pressure results in closing of AV valves • Isovolumetric contraction phase (all valves are closed) • In ejection phase, ventricular pressure exceeds pressure in the large arteries, forcing the SL valves open • End systolic volume (ESV): volume of blood remaining in each ventricle
Phases of the Cardiac Cycle • Isovolumetric relaxation occurs in early diastole • Ventricles relax • Backflow of blood in aorta and pulmonary trunk closes SL valves and causes dicrotic notch (brief rise in aortic pressure)
Phases of the Cardiac Cycle Figure 20.16
Cardiodynamics • Movements and forces generated during cardiac contractions • End-diastolic volume (EDV) – the amount of blood in each ventricle at the end of ventricular diastole (before contraction begins) • End-systolic volume (ESV) - the amount of blood remains in each ventricle at the end of ventricular systole
Cardiodynamics • Stroke volume (SV) – The amount of blood that leaves the heart with each beat or ventricular contraction; EDV-ESV=SV • Not all blood ejected • Normal Adult 70 ml / beat • Ejection fraction – The percentage of end-diastole blood actually ejected with each beat or ventricular contraction. • Normal adult 55-70% (healthy heart)
Stroke Volume and Cardiac Output • Cardiac output (CO) – the amount of blood pumped by each ventricle in one minute. • Physiologically, CO is an indication of blood flow through peripheral tissues • Cardiac output equals heart rate times stroke volume; Normal CO: Approximately 4-8 liters/minute
Figure 18.8 2 The pressure changes within the aorta, left atrium, and left ventricle during the cardiac cycle ATRIAL DIASTOLE ATRIAL SYSTOLE ATRIAL SYSTOLE ATRIAL DIASTOLE VENTRICULAR SYSTOLE VENTRICULAR DIASTOLE VENTRICULAR DIASTOLE Aortic valve closes. 120 Aortic valve opens. Aorta 90 Dicrotic notch KEY Atrial contraction begins. Pressure (mm Hg) Atria eject blood into ventricles. 60 Atrial systole ends; AV valves close. Left ventricle Isovolumetric contraction. Ventricular ejection occurs. Semilunar valves close. Isovolumetric relaxation occurs. 30 Left AV valve closes. Left atrium AV valves open; passive ventricular filling occurs. Left AV valve opens. 0 200 0 300 400 500 700 800 100 600 Time (msec) The correspondence of the heart sounds with events during the cardiac cycle S1 S2 S4 S4 S3 Heart sounds “Lubb” “Dubb”
Left heart QRS P T P Electrocardiogram 1st 2nd Heart sounds Dicrotic notch Aorta Pressure (mm Hg) Left ventricle Atrial systole Left atrium EDV Ventricular volume (ml) SV ESV Atrioventricular valves Open Closed Open Aortic and pulmonary valves Closed Open Closed Phase 1 2a 2b 3 1 Left atrium Right atrium Left ventricle Right ventricle Ventricular filling Atrial contraction Ventricular ejection phase Isovolumetric relaxation Ventricular filling Isovolumetric contraction phase 1 2a 2b 3 Ventricular filling (mid-to-late diastole) Ventricular systole (atria in diastole) Early diastole Figure 18.20
Factors Affecting Cardiac Output Figure 20.20
Extrinsic Innervation of the Heart • Heartbeat is modified by the ANS • Cardiac centers are located in the medulla oblongata • Cardioacceleratory center innervates SA and AV nodes, heart muscle, and coronary arteries through sympathetic neurons • Cardioinhibitory center inhibits SA and AV nodes through parasympathetic fibers in the vagus nerves
Effect inotropy – (from Greek, meaning fiber) effect on contractility of the heart • Effect chronotropy – effect on HR • Effect dromotropy – Derives from the Greek word "Dromos", meaning running. • A dromotropic agent is one which affects the conduction speed in the AV node • Sympathetic stimuli has a positive effect (increase) all • Parasympathetic stimuli has a negative effect (decrease) all
Autonomic Nervous System Regulation • In healthy conditions, parasympathetic effects dominate and slows the rate of the pacemaker from 80-100 bpm to a 70-80 bpm. • The binding of Ach to muscarinic receptors (M2) inhibit NE release (mechanism by which vagal stimulation override sympathetic stimulation) • Sympathetic nervous system is activated by emotional or physical stressors • Norepinephrine causes the pacemaker to fire more rapidly (and at the same time increases contractility) • Parasympathetic nervous system opposes sympathetic effects • Acetylcholine hyperpolarizes pacemaker cells by opening K+ channels • The heart at rest exhibits vagal tone (parasympathetic)
Autonomic Neurotransmitters Alter Heart Rate KEY Integrating center Cardiovascularcontrolcenter in medullaoblongata Efferent path Effector Tissue response Parasympatheticneurons (Ach) Sympathetic neurons(NE) 1-receptors ofautorhythmic cells Muscarinic receptorsof autorhythmic cells K+ efflux; Ca2+ influx Na+ and Ca2+ influx Hyperpolarizes cell and rate of depolarization Rate of depolarization Heart rate Heart rate Figure 14-27
Figure 18.11 1 Heart rate under three conditions: at rest, under parasympathetic stimulation, and under sympathetic stimulation A prepotential or pacemaker potential in a heart at rest Normal (resting) Prepotential (spontaneous depolarization) +20 0 Membrane potential (mV) –30 Threshold –60 Heart rate: 75 bpm 0.8 1.6 2.4 Time (sec)
Figure 18.11 2 Heart rate under three conditions: at rest, under parasympathetic stimulation, and under sympathetic stimulation A prepotential or pacemaker potential in a heart at rest Increased heart rate resulting when ACh released by parasympathetic neurons opens chemically gated K+ channels, thereby slowing the rate of spontaneous depolarization Parasympathetic stimulation +20 0 Membrane potential (mV) –30 Threshold Hyperpolarization –60 Heart rate: 40 bpm Slower depolarization 2.4 1.6 0.8 Time (sec)
Figure 18.11 3 Heart rate under three conditions: at rest, under parasympathetic stimulation, and under sympathetic stimulation Decreased heart rate resulting when NE released by sympathetic neurons leads to the opening of ion channels, increases the rate of depolarization and shortens the period of repolarization Sympathetic stimulation +20 0 Membrane potential (mV) –30 Threshold Reduced repolarization –60 More rapid depolarization Heart rate: 120 bpm 0.8 2.4 1.6 Time (sec)
Chemical Regulation of Heart Rate • Hormones • Epinephrine from adrenal medulla enhances heart rate and contractility • Thyroxine increases heart rate and enhances the effects of norepinephrine and epinephrine • Intra- and extracellular ion concentrations (e.g., Ca2+ and K+) must be maintained for normal heart function
Homeostatic Imbalances • Tachycardia: abnormally fast heart rate (>100 bpm) • If persistent, may lead to fibrillation • Bradycardia: heart rate slower than 60 bpm • May result in grossly inadequate blood circulation • May be desirable result of endurance training
Factors Affecting Stroke Volume Figure 20.23
Regulation of Stroke Volume • SV = EDV – ESV • Three main factors affect SV • Preload • Contractility • Afterload
Regulation of Stroke Volume • Preload • The amount of tension on a muscle before it begins to contract. The preload of the heart is determined by the EDV. • In general, the greater the EDV the larger is the stroke volume : EDV-ESV=SV • These relationships is known as the Frank-Starling principle/Sterling’s law of the heart : • The force of cardiac muscle contraction is proportional to its initial length • The greater the EDV the larger the preload
Preload and Stroke Volume • Frank-Starling law states • Stroke volume increase as EDV increases • EDV is affected by venous return • Venous return is affected by • Skeletal muscle pump • Respiratory pump • Sympathetic innervation
Factors Affecting stroke volume - Preload/EDV • Stroke volume is the difference between the EDV and ESV. Changes in either one can change the stroke volume and cardiac output: • The EDV volume is affected by 2 factors: • The filling time – duration of ventricular diastole; depends on HR – the faster the HR the shorter is the available filing time • The venous return – changes in response to several changes: cardiac output, blood volume, peripheral circulation.
Reminder - Length-tension relationship • The force of muscle contraction depends on the length of the sarcomeres before the contraction begins • On the molecular level, the length reflects the overlapping between thin and thick filaments • The tension a muscle fiber can generate is directly proportional to the number of crossbridges formed between the filament
Stroke Volume • Length-force relationships in intact heart: a Starling curve Figure 14-28
Diastolic filling increased EDV increase (preload increased) Cardiac muscle stretch increased Force of contraction increased Ejection volume increased
Regulation of Stroke Volume - Afterload • The amount of resistancethe ventricular wall must overcome to eject blood during systole (influenced by arterial pressure). • The greater is the afterload, the longer is the period of isovolumetric contraction (ventricles are contracting but there is no blood flow), the shorter the duration of ventricular ejection and the larger the ESV – afterload increase – stroke volume decrease • Hypertension increases afterload, resulting in increased ESV and reduced SV
Regulation of Stroke Volume - Contractility • Force of ventricular contraction (systole) regardless of EDV • Positive inotropic agents increase contractility • Increased Ca2+ influx due to sympathetic stimulation • Hormones (thyroxine and epinephrine) • Negative inotropic agents decrease contractility • Increased extracellular K+ (hyperpolarization) • Calcium channel blockers (decrease calcium influx)
Congestive Heart Failure (CHF) • Progressive condition where the CO is so low that blood circulation is inadequate to meet tissue needs • Caused by • Coronary atherosclerosis • Persistent high blood pressure • Multiple myocardial infarcts (decreased blood supply and myocardial cell death) • Dilated cardiomyopathy (DCM) – heart wall weakens and can not contract efficiently. Causes are unknown but sometimes associated with toxins (ex. Chemotherapy), viral infections, tachycardia and more
Electrocardiography (ECG or EKG) • Body fluids are good conductors which allows the record of the myocardial action potential extracellularly • EKG pairs of electrodes (leads) one serve as positive side of the lead and one as the negative • Potentials (voltage) are being measured between the 2 electrodes • EKG is the summed electrical potentials generated by all cells of the heart and gives electrical “view” of 3D object (different from one action potential) • EKG shows depolarization and repolarization
Einthoven’s Triangle Right arm Left arm I Electrodes areattached to theskin surface. II III A lead consists of twoelectrodes, one positiveand one negative. Left leg Figure 14-19