Download

1 / 18
180 likes | 377 Views
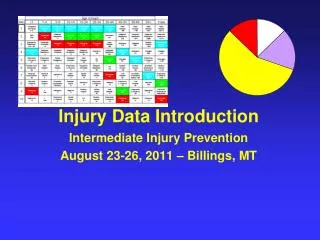
WISQARS TM Centers For Disease Control & Prevention National Center for Injury Prevention and Control. Intermediate Injury Prevention August 23-26, 2011 Billings, MT. WISQARS:. W eb-based I njury S tatistics Q uery and R eporting S ystem

E N D
WISQARSTMCenters For Disease Control & PreventionNational Center for Injury Prevention and Control Intermediate Injury Prevention August 23-26, 2011 Billings, MT Billings Area Indian Health Service
WISQARS: • Web-based Injury Statistics Query and Reporting System • Interactive database system that provides customized reports of injury-related data useful for research and for making informed public health decisions. http://www.cdc.gov/ncipc/wisqars/
Data Sources: Mortality Data • Official state death certificates • Compiled by all the states and submitted to the National Center for Health Statistics for the entire country. • Population data come from the Bureau of Census. Morbidity Data • Estimates based on weighted data from the U.S. Consumer Product Safety Commission's (CPSC) National Electronic Injury Surveillance System (NEISS). http://www.cdc.gov/ncipc/wisqars/
Limitations: • WISQARS does not: • Provide date earlier than 1981 • Provide non-injury data, except what is available on the leading causes of death reports. • The data can be selected down to the state level, but you cannot select a specific county or individual tribes. http://www.cdc.gov/ncipc/wisqars/
Coding Data: • Injury death data are assigned an external cause of death code called “E-codes”. • Data from 1979-1998 are coded according to the 9th Revision of the International Classification of Diseases (ICD-9) • Starting with1999, deaths are coded with the 10th revision, or ICD-10. • The ICD-10 has a new coding scheme that is different than the old e-codes, so it is not valid to combine 1999 data with earlier years at this time. http://www.cdc.gov/ncipc/wisqars/
WISQARS Reports: • Fatal Injury Data • Non-Fatal Injury Data • Violent Death Data (new and limited) http://www.cdc.gov/ncipc/wisqars/
WISQARS Fatal Injury Data: • Fatal Injury Reports • Leading Causes of Death Reports • Years of Potential Life Lost (YPLL) • Fatal Injury Mapping (New)
Fatal Injury Reports: • Provides tables of total numbers of injury deaths and rates per 100,000 population. • You can request a report to list deaths by • Cause and intent of injury • State of residence • Race • Sex • Age • Year http://www.cdc.gov/ncipc/wisqars/
Leading Causes of Death Reports : • Compute the leading causes of death. • Tables show the impact of a particular cause of death • Highlight the role that injuries play in mortality at different age groups. • Report of leading cause of death report by state of residence, race, sex, year or combined years, and number of causes such as 10 leading causes of death. • Can select only injuries and create a leading cause of injury death chart. http://www.cdc.gov/ncipc/wisqars/
Years of Potential Life Lost (YPLL) : • Measure of premature mortality (early death). • YPLL provides insight into the impact of injury-related causes of death compared to other causes of death. • YPLL is most commonly calculated as the number of years lost before age 65 “65 – Age of Death = YPLL” • YPLL can be reported by state of residence, race, sex, and year or combined years. http://www.cdc.gov/ncipc/wisqars/
Fatal Injury Mapping (New): • Interactive mapping module for fatal injury data • Can map down to County level http://www.cdc.gov/ncipc/wisqars/
Small Numbers: • American Indian/Alaska Native population numbers are small • You may need to combine years of data to get a more accurate picture • The NCHS considers any rate based upon fewer than 20 deaths to be an unstable rate. • Having larger numbers to base the rate on gives you more confidence that the rate is representative. http://www.cdc.gov/ncipc/wisqars/
Small Numbers: • EXAMPLE - drowning deaths among Alaska Natives during 1999 • 16 deaths and a rate of 17.3 per 100,000. • Because there were fewer than 20 deaths, this rate is considered unstable. • To make this information more useful, you would need to combine at least two years of data. • WISQARS shows unstable rates colored white with an asterisk (*). • The Leading Causes of Death report and YPLL will work best for Native Americans by combining years of data, • Three years: 1996, 1997, and 1998. • This will give more numbers to look at. • For Fatal Injury Reports, if states are chosen, then combining 3 years of data may also be needed depending on the injury cause. http://www.cdc.gov/ncipc/wisqars/
Example: * Rates based on 20 or fewer deaths may be unstable. Use with caution.
WISQARS Non-Fatal Data: • Non-Fatal Injury Reports • Leading Causes of Death Reports
WISQARS Non-Fatal Data: • Limitations • No data before 2000 • Can sort by Race but not select by Race • American Indian/Alaskan Native not defined in Non-Fatal data set
WISQARS Exercise: • Computer Lab • Complete worksheet • Generate reports, calculate rates, compare injury data using WISQARS Fatal Injury Reports, Leading Cause of Death Reports and Years of Potential Life Lost (YPLL). http://www.cdc.gov/ncipc/wisqars/