
Uploaded by
kapono
1 SLIDES
135 VIEWS
10LIKES
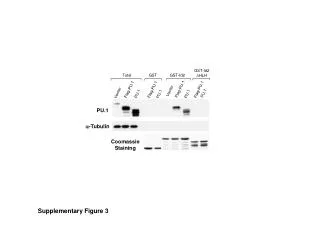
Coomassie Staining of a-Tubulin: Supplementary Figure 3 with GST-PU Vector Analysis
DESCRIPTION
This supplementary figure illustrates the Coomassie staining results of a-tubulin using the GST-PU vector system. The data provides insights into protein expression levels and purity following purification. The GST-Id2 and associated flags are also detailed, highlighting the effectiveness of the purification strategies employed. This figure serves as a valuable visual representation for those studying protein interactions and purification methods, offering a clearer understanding of the molecular processes involved.
Download
1 / 1
Download Presentation 
Coomassie Staining of a-Tubulin: Supplementary Figure 3 with GST-PU Vector Analysis
An Image/Link below is provided (as is) to download presentation
Download Policy: Content on the Website is provided to you AS IS for your information and personal use and may not be sold / licensed / shared on other websites without getting consent from its author.
Content is provided to you AS IS for your information and personal use only.
Download presentation by click this link.
While downloading, if for some reason you are not able to download a presentation, the publisher may have deleted the file from their server.
During download, if you can't get a presentation, the file might be deleted by the publisher.
E N D
Presentation Transcript
GST-Id2 DHLH Total GST GST-Id2 Flag-PU.1 Flag-PU.1 Flag-PU.1 Flag-PU.1 Vector PU.1 PU.1 PU.1 PU.1 Vector PU.1 a-Tubulin Coomassie Staining Supplementary Figure 3


More Related