
Uploaded by
serena
3 SLIDES
125 VIEWS
30LIKES
Occupational Lead Exposure Data Analysis 2003-2004
DESCRIPTION
Explore the distribution and rates of workers with blood lead levels ≥25 µg/dL in various industries and states, as well as detailed construction sectors in 2003-2004. Detailed insights into occupational lead exposure.
Download
1 / 3
Download Presentation 
Occupational Lead Exposure Data Analysis 2003-2004
An Image/Link below is provided (as is) to download presentation
Download Policy: Content on the Website is provided to you AS IS for your information and personal use and may not be sold / licensed / shared on other websites without getting consent from its author.
Content is provided to you AS IS for your information and personal use only.
Download presentation by click this link.
While downloading, if for some reason you are not able to download a presentation, the publisher may have deleted the file from their server.
During download, if you can't get a presentation, the file might be deleted by the publisher.
E N D
Presentation Transcript
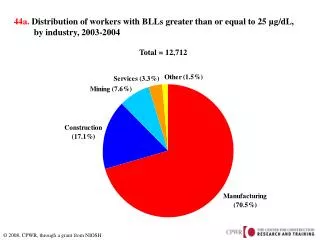
44a. Distribution of workers with BLLs greater than or equal to 25 µg/dL, by industry, 2003-2004 Total = 12,712
44b. Rate ofworkers with BLLs greater than or equal to 25 µg/dL in construction, by state, 2003-2004
44c. Number of workers with BLLs greater than or equal to 25 or 40 µg/dL, by detailed construction sector, 2003-2004 1,051 412 406 92 70 41 41 39 14


More Related