Internal Process Model
Internal Process Model. Monitor Role Competency: Managing Collective Performance. Agenda. Brainstorm check-in improvement options See demonstration of control chart program Complete remaining scenarios Review as a class. Learning Goals. Be able to:

Internal Process Model
E N D
Presentation Transcript
Internal Process Model Monitor Role Competency: Managing Collective Performance
Agenda • Brainstorm check-in improvement options • See demonstration of control chart program • Complete remaining scenarios • Review as a class
Learning Goals Be able to: • Distinguish between special and common causes of variation • Describe how you would use control charts as a tool of TQI • What their purpose is • When you use them • How they help distinguish type of cause
Patient Check-In Process Using Fishbone Diagram to Develop Improvement Ideas
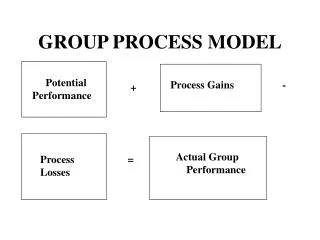
Every Process Has Variation • Time to feed nursing home patients • Frequency of nosocomial infections • Days in accounts receivable
Two Basic Types of Variation • Common Cause: Due to interactions of variables within processes • Inherent in the process as it now occurs • Special Cause: Due to specific causes • “Assignable” • May be attributable to an individual
Two Frequent Mistakes • Mistaking common cause variation for special • Mistaking special cause variation for common
Special Cause Variation • May not need to fix at all • May be fixed by adjusting one or two things • Just involves 1-2 people
Common Cause Variation • Won’t change unless you change one or more factors in the process • Best fixed by all the process ‘owners’
The Rule is… • First remove special causes and then change the fundamental process
We Use Control Charts to • See how variable the process is • Determine if special or common cause • Find out what effects changes have made
Run chart: Display of data in the order in which they appear Control Chart: Run Chart with upper and lower control limits
Upper and Lower Control Limits • UCL = x-bar + 3*(r-bar/1.128) • LCL= x-bar - 3*(r-bar/1.128) • Where R-bar = sum of ranges/# ranges • 1.128 is a statistically derived constant
How Many Data Points Do You Need? • At least 25 • This provides context
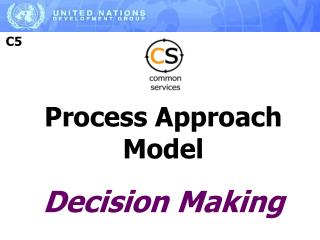
Control Charts: What Type of Chart to Use for Different Types of Data
Attribute Data: Defects (Counts) • # times an event of interest occurs in a given period • Number of failures • # infections/1000 patients • # service interruptions in a given time • # complaints/month • U Charts (variable sample size)
Attribute Data: Defective (Proportion) • How many events failed out of a given total • What % went wrong • Bad x-rays • Phone calls where caller hung up • Patient treatments interrupted • Proportion of staff calling in sick • P charts (variable sample size)
Variable Data (Continuous) • Can theoretically assume infinitely variable values • Amount of substance present in sample • Time to complete a task • Dimensions of a wound • Flow rate of a liquid • X charts
How to Interpret Control Charts Three lines: • Median (average) • Upper Control Limit • Lower Control Limit
How To Interpret Control Charts • 1: Unusually large or small values • 2c: Shifts in the middle value • 2d: Trends • 2e: Zigzags