Download
1 / 32
340 likes | 475 Views
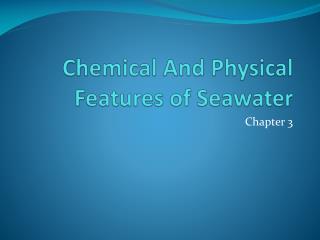
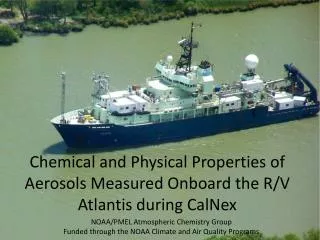
Chemical and Physical Properties of Aerosols Measured Onboard the R/V Atlantis during CalNex. NOAA/PMEL Atmospheric Chemistry Group Funded through the NOAA Climate and Air Quality Programs. Data Analysis. Q-AMS: chemistry DMPS-APS: aerosol number size distributions

E N D
Chemical and Physical Properties of Aerosols Measured Onboard the R/V Atlantis during CalNex NOAA/PMEL Atmospheric Chemistry Group Funded through the NOAA Climate and Air Quality Programs
Data Analysis • Q-AMS: chemistry • DMPS-APS: aerosol number size distributions • Meteorological parameters measured on the ship http://saga.pmel.noaa.gov/data/ • Thermo-denuder SMPS system: changes in number size distributions heated to 230°C • FLEXPART products (Jerome BrioudeUofCO & NOAA-ESRL)
Submicrometer NR Aerosol Mass along the Atlantis Cruise Track Mean concentration 3.5 ug m-3 (0.05 – 19 ug m-3)
Case Studies • Background marine air flow to CA • Inland – Sacramento Ship Channel • Santa Monica Bay • Port of Long Beach/LA
Case Studies • Background marine air mass – on shore flow to CA Hysplit back trajectory Flexpart total column residence time
Particle Number (cm-3) Sulfate Mass (ugm-3)
Very low organic aerosol concentrations.Very acidic submicrometer sulfate aerosol (NH4+/SO4= MR <<1).Burst of small particles (high number low mass) in afternoon.
Ambient T Accumulation mode Aitken mode Accumulation and Aitken modes have a volatile component 230°C Seasalt number mode
Pre-CalNEX 226 measurements 1985-2010 CalNex 850 measurements Seawater DMS Concentrations May-October http://saga.pmel.noaa.gov/dms/ Sulfur Transport to CA 5 day DMS lifetime, 35% onshore flow 2.3e8 gS/day (Bates & Cline, 1985) US West Coast Shipping, 0.5% S Fuel 0.13e8 gS/day (Eric Williams, CSD) Combined data sets
Case Study 2Sacramento Ship ChannelJune 4-6, 2010 Surface residence time plots 06/04 at 1100-1400 06/05 at 2000-2300 Jerome Brioude http://www.esrl.noaa.gov/csd/metproducts/flexpart/static_pages/atlantisimage.html
Sacramento Ship Channel Suisun Bay Turning Basin Turning Basin
Ambient T Mid-day local time aerosol nucleation events 230°C Aerosol size reduced upon heating
Ambient T Mid-day local time aerosol nucleation events 230°C
Number distribution dominated by Aitken and Nuclei mode particles.
Case Study 4Port of Long Beach/LA S NW SE NW SE NW
Summary • Background marine air mass – on shore flow to CA, most likely aerosol mixed into the MBL from the FT. Background concentration of ≈2 μg/m3 of acidic sulfate. • Inland – Sacramento Ship Channel. New particle production each day mainly organic mass on a non-volatile core. Sulfate mass hours downwind of major point sources. • Santa Monica Bay – seabreeze bringing highest aerosol mass concentrations measured during the experiment. Organic/sulfate/nitrate on non-volatile core. • Port of Long Beach/LA – S flow (SO2, organic mass), NW flow (low aerosol mass concentration), SE flow (elevated organic, sulfate, nitrate, ammonium mass concentrations)
Summary of CalNex Emission Factor Data Ship type g NO2 /kg fuel g SO2 /kg fuel g CO /kg fuel Speed, knots # ships Container ships 78.4±34.7 (23) 7.1±6.5 (21) 4.3±6.5 (23) 8.1 – 20 18 Freighters 64.0±24.8 (3) 3.6±3.7 (3) 2.5±2.1 (2) 5.7 – 11.4 3 Tankers 62.2±6.7 (2) 7.2±9.4 (2) 2.2±3.2 (2) 11.7 – 14.7 2 Vehicle carrier 57.0±13.7 (3) 7.2±7.2 (3) 7.6±11 (3) 7.4 – 18.1 1 Cruise ships 55.7±5.6 (5) 0.5±0.3 (5) 0.7±1.0 (5) 11.1 – 20.6 3 High-speed (ferries) 33.7±13.2 (12) 0.1±0.4 (11) 2.9±3.7 (11) 7.0 – 30.1 6 Anchored ships 26.4±16.1 (21) 4.0±6.8 (21) 6.9±9.4 (21) 0 12 Summary of Houston Emission Factor Data Ship type g NO2 /kg fuel g SO2 /kg fuel g CO /kg fuel Container ships 59.8±20.8 (9) 30.4±16.6 (6) 9.8±6.4 (10) Freighters 87.0±29.6 (11) 20.4±15.6 (11) 7.0±3.5 (10) Tankers 79.2±23.4 (12) 27.3±17.4 (9) 16.7±15.3 (9)
SO2 Emissions from Commercial Marine Vessels 1. Mission Avg. SO2 EF fuel %S Max SO2 EF fuel %S CalNex 2010 4.4 (±5.7) 0.2 28 1.4 TexAQS 2006 15.5 (±16.7) 0.78 70 3.5 Current ARB regulations cap marine fuel S at 1.5% for MGO; 0.5% for MDO • Our data indicate 100% compliance with regulation 2. Biogenic vs Commercial Marine Vessel Sulfur Sources off the California Coast DMS emission and import (Bates and Lamb, GBC, 1992): 7.1e6 mol/day (Assume: 5 day (summer) DMS lifetime; average wind speed; 35% onshore) Import of DMS sulfur = 2.3e8 gS /day US west coast ship SO2 emissions for 2002: 80,200 metric tons (Corbett, 2004) (Assume: CA fraction of coast = 0.62; all emissions reach shore; fuel S = 2.7%) Import of CMV sulfur = 0.68e8 gS /day (0.13e8 gS/day with 0.5% S fuel) • New ARB regs take place in 2012 fuel S < 0.1% • North American Emission Control Area regs take place in 2012 fuel S <1% in 2015 fuel S <0.1%
Sulfur Dioxide Emissions from Ships During CalNex 2010 Eric Williams NOAA/ESRL/CSD BACKGROUND • Marine Notice 2009-4; 25 Jun 2009 requires cleaner fuels in 24 NM zone MGO at < 1.50 % fuel-S MDO at < 0.5 % fuel-S • Applies to all engines and boilers CalNex study May-Jun 2010 • R/V Atlantis: NOAA-chartered • Gas-phase and aerosol measurements • Marine vessel emissions was a focus CalNex 2010 Emission Factor Data Ship type g SO2 /kg fuel %fuel-S Container ships 7.1±6.5 (21) 0.36 Freighters 3.6±3.7 (3) 0.18 Tankers 7.2±9.4 (2) 0.36 High-speed (ferries) 0.1±0.4 (11) 0.01 Anchored ships 4.0±6.8 (21) 0.20 STUDY MAXIMUM 28.4 1.42 STUDY MEDIAN 0.69 0.03 Houston 2006 Emission Factor Data Ship type g SO2 /kg fuel % fuel-S Container ships 30.4±16.6 1.52 Freighters 20.4±15.6 1.02 Tankers 27.3±17.4 1.37 STUDY MAXIMUM 70.4 3.52 STUDY MEDIAN 6.39 0.32 R/V Atlantis cruise track and ports Exhaust Plume from tanker Taipan SUMMARY and FINDINGS • To date 123 ship plume analyses are done • Data show compliance with 1.5% fuel-S limit • More than 80% compliance with 0.5% limit • Our data measure all emissions from the stack – main engine, aux engine, boilers • Our data cannot distinguish what fuel types – HFO, MDO, MGO – are in use • Median fuel-S is X10 lower for CalNex than for Houston Slope = 5.0 ppbv/ppmv E.F. = 23.0 g SO2/kg fuel Fuel-S = 1.15% by weight MEASUREMENTS • Highly correlated CO2 and SO2 • CO2 is measure of fuel burned • SO2 only from fuel-S content ANALYSIS • Calculate slope of SO2 vs CO2 • Slope * 4.6 = Emission factor • Emission factor/20 = % fuel-S