Download
1 / 16
170 likes | 359 Views
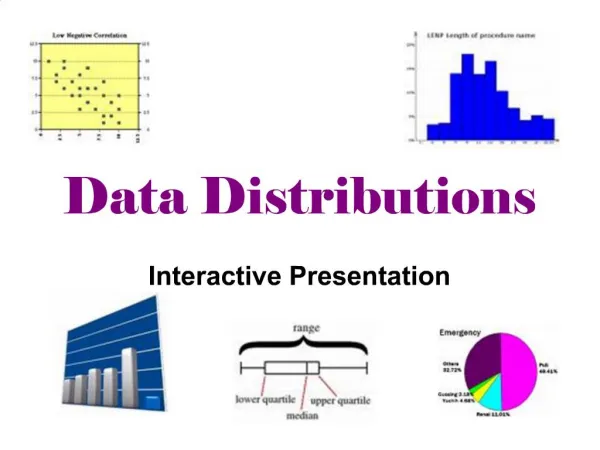
Learn to describe data distributions' shapes using appropriate vocabulary. Explore examples, vocabulary words, and identify characteristics such as symmetry, peaks, skewness, uniformity, gaps, and outliers.

E N D
Warm Up OBJECTIVE: Learn to describe the shape of a distribution of data using appropriate vocabulary. James kept track of how much he spent on lunch each day for a week, and got the following results: $5, $7, $4, $5, $10, $6, $5 • What is the median of this data? • What is the mean of this data? • What is the range of this data? Alexis asked 10 people what their favorite color is, and got the following answers: Blue, green, orange, yellow, blue, blue, red, black, red, green 4. Why doesn’t it make sense to find the mean, median, or range of this data? Agenda
Launch – Next Step Lets take a look at the middle names of two classes, and compare their center and spread. Center: ____4_____ Center: ____4_____ ____7 - 1 = 6_____ Spread: Spread: ____7-1 = 6_____ Agenda
Launch B “These bar graphs have the same center and spread, but they are completely different!” Agenda
Summary – Vocabulary To accurately describe the shape of a distribution, there is a standard group of vocabulary words that can help us. Copy the following vocabulary words and definitions onto your worksheet. Agenda
Summary – Vocabulary 1. Symmetry: When it is graphed, a symmetric distribution can be divided at the center so that each half is a reflection of the other. Examples: Agenda
Summary – Vocabulary 2. Peak: A point on the graph that is higher than the points directly to the left and right. Examples: One Peak Two Peaks Agenda
Summary – Vocabulary 3. Skewed left/right: A graph is skewed left if it is highest to the right, then becomes lower as it goes left. A graph is skewed right if it is highest at the left and lowers as it goes right. Examples: Skewed Left Skewed Right Agenda
Summary – Vocabulary 4. Uniform: A graph that is evenly spread out, with no peaks. Examples: Uniform Agenda
Summary – Vocabulary Distributions may also have unusual features. The two most common ones are: 6. Gap: An area of the distribution where there are no entries in the data set. 7. Outlier: An element of the data set that is much higher or much lower than all the other elements. Outlier Examples: Gap Agenda
Summary – Looking Back Let’s go back to the two graphs we looked at earlier. How can we describe them using the vocabulary that we just learned? Hint: Go right down the vocabulary list and identify each one. Remember – Symmetry, Peaks, Skew, uniform, unusual features. scaffolding Agenda
Practice – Interactive Classwork We will now complete the back side of your class work. Describe the shape of each graph with as much detail as possible. Agenda
Practice Describe the SHAPE of this graph: Symmetry: Peaks: Skewness: Uniformity: Gaps: Outliers: Symmetric about 4 One peak at 4 Not Skewed Not Uniform No Gaps Take it further! No Outliers Can you calculate a center for this graph? Can you calculate a spread for this graph? Graphs that are symmetric with one peak are also called “normal distributions” since they are the most common. Fun Fact! Agenda
Practice Describe the SHAPE of this graph: Symmetry: Peaks: Skewness: Uniformity: Gaps: Outliers: Symmetric about 3.5 (Disregard the outlier) No Peak Not Skewed Uniform Gap at 7 Outlier at 8 Agenda
Practice Describe the SHAPE of this graph: Symmetry: Peaks: Skewness: Uniformity: Gaps: Outliers: Not Symmetric Two Peaks at 2 and 6 Not Skewed Not Uniform One Gap at 4 No Outliers Agenda
Practice Describe the SHAPE of this graph: Symmetry: Peaks: Skewness: Uniformity: Gaps: Outliers: Not Symmetric One peak at 1 Skewed right Not Uniform No Gaps Take it further! No Outliers Can you calculate a center for this graph? Can you calculate a spread for this graph? Agenda