Download
1 / 1
10 likes | 191 Views
Proxy ABI datasets relevant for fire detection that are derived from MODIS data . P1.35. Scott S. Lindstrom, 1 Christopher C. Schmidt 2 , Elaine M. Prins 2 , Jay Hoffman 2 , Jason C. Brunner 2 , and Timothy J. Schmit 3

E N D
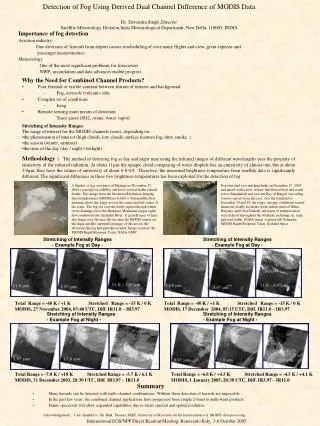
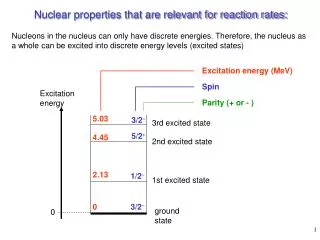
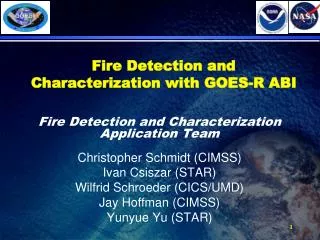
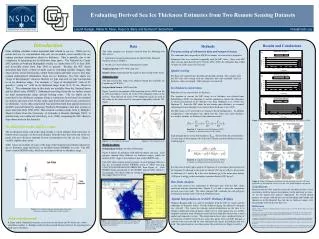
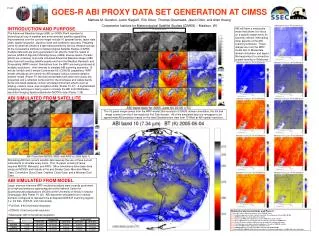
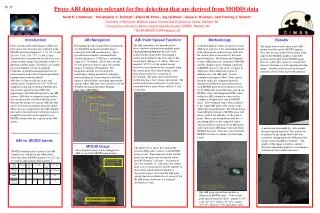
Proxy ABI datasets relevant for fire detection that are derived from MODIS data P1.35 Scott S. Lindstrom,1 Christopher C. Schmidt2, Elaine M. Prins2, Jay Hoffman2, Jason C. Brunner2, and Timothy J. Schmit3 1 University of Wisconsin-Madison Space Science and Engineering Center, Madison WI 2 Cooperative Institute for Meteorological Satellite Studies (CIMSS), Madison WI 3 NOAA/NESDIS/ORA Madison, WI Introduction ABI Navigation ABI Point Spread Function Methodology Results The ABI radiometers are hypothesized to detect emitted radiation from multiple pixels. The point spread function describes how radiant energy from pixels surrounding a central pixel influences the raw value at that central pixel (Zheng et al., 2006). The vast majority (>99.9%) of the radiant energy viewed by the radiometer does originate from the central pixel. How much energy comes from adjacent pixels is a function of wavelength. The point spread function for visible data has a very strong central peak. The central peak for near-infrared (3.7 mm) data is somewhat flatter, and is flatter still for 11 and 12 mm data. Proxy Advanced Baseline Imager (ABI) data relevant for fire detection are computed using MODIS data from channels 1, 2, 21, 22, 31 and 32 (0.65, 0.86, 3.99, 3.97, 11 and 12 mm). Simulated data are produced for three fire case studies in three unique fire domains subject to different satellite angles. The three case studies represent wildfire activity in southern California, agricultural management fires in central America and deforestation/agricultural management in western Brazil. ABI data at 2-km resolution (at the sub-satellite point, assumed to be 0 N, 75 W) are computed using full-resolution MODIS data and a point spread function (PSF) that approximates the PSF anticipated for the ABI sensors. ABI data so computed from satellite data are physically consistent and thus have inherent advantages over proxy ABI data that can be derived from numerical model output. These data are computed for the ABI channels relevant for fire detection, but the procedure is straightforward and can be applied to any MODIS channel that has a match in the ABI sensor. Remapping the data required the development of a McIDAS navigation module that is consistent with ABI specifications. Those specifications mandate a nominal Earth-satellite distance of 35786 km, a subtending angle of 17.76 degrees, 22141 lines (for the 0.5-kilometer resolution) and a sub-satellite point at 75 degrees W longitude. The navigation module was developed by modifying a similar module for remapped meteosat imagery. A representative full-disk image is shown below, including approximate regions where ABI data were created to test the Wildfire Automated Biomass Burning Algorithm (WFABBA). Latitude/longitude values are known at each ABI pixel, and also at the surrounding pixels from which points radiant energy leaks into the central pixel as described by the point spread function. The latitude and longitude of these ABI points are converted to MODIS satellite imagery space, defining a polygon in MODIS space (vs. the circle or square in ABI space) that outlines the region of influence for each ABI pixel. See the example in the figure below. Point spread function values are computed from the interpolated ABI point spread function for each MODIS pixel in the footprint covered by the ABI point spread function, and all raw MODIS values and interpolated PSF values within the ABI footprint are then used to compute a weighted raw sum in MODIS space. That weighted sum is then assigned to the single ABI pixel at the center of the ABI point spread function. The interpolation from ABI point spread to MODIS space will always reduce the influence of the central point. That is, the interpolation will have a smoothing effect on the computed values. This procedure is repeated for all ABI pixels and results in an ABI image with data where MODIS data exist. Data are converted from MODIS raw data to radiances before being stored. The figure below shows the pseudo ABI image created from the MODIS imagery. Note that because of the bowtie effect at the edge of the MODIS imagery, some ABI pixels near the limb of the MODIS image have no values. Hot values associated with fires in California are well-reproduced in this image. Similar results have been obtained from data over Central and South America. Southern California Central America South America A natural question might be: why include the point spread function? The reason can be inferred in the image below that was created by remapping to the ABI projection using a nearest neighbor technique. The quality of the image is inferior, and fire detection algorithms applied to such imagery yield incorrectly smaller burn areas. ABI vs. MODIS bands MODIS image The figure above shows the relationship between ABI points (yellow x) and MODIS points (cyan). Superimposed on the satellite points are the point spread function values for ABI Channel 1 (.64 mm). For infrared data (for example, 11.2 mm data), the central peak is not so pronounced, and the number of pixels from which emitted radiation is observed is larger. Note that the ABI point spread function is defined on a 1-km grid, but the ABI points shown are at a nominal resolution of 2 km. Any navigated image can be remapped to ABI; we used the MODIS image below. MODIS channels used as proxies for ABI channels are outlined in the table below. Note that either MODIS channel 21 or 22 can be used to approximate ABI channel 7. Note the very dark regions where fires are occurring ABI covers the earth approximately five times faster than the current Imager. The ABI point spread function here is elliptical in MODIS space. Colors show point spread function values: purple (0-102), cyan (102-103), yellow (103-104), orange (104-105), blue (105-106) and white (>106). Channel 22 is at 3.97 mm (near-IR)