Download
1 / 41
410 likes | 594 Views
Water and Environment Issues and Strategic Approach on Integrated Water and Environment Management LIPING JIANG WORLD BANK OFFICE BEIJING CHINA September 16, 2013.

E N D
Water and Environment Issues and Strategic Approach on Integrated Water and Environment Management LIPING JIANG WORLD BANK OFFICE BEIJING CHINA September 16, 2013
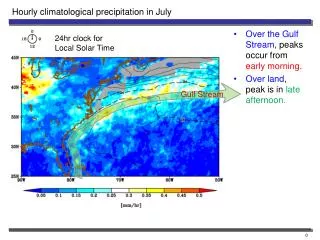
Nearly half of China's population lives in water-shortage areas in the north, where most of the country’s grain is produced, and where the capital and other big cities are located.
Per Capita Water Resources World: 10,700 m3/person China: 2,700 m3/person; and Beijing: 248 m3/person; International Warning Line: < 1,000 m3/person Precipitation for the other eight months Precipitation in June, July, August and September
China feeds its people about 21% of the world’s total population depending on 6% of water resources and 9% of total arable land in the world !
To address water scarcity and pollution issues • Traditional Approach • For irrigated agricultural water use: • To increase irrigation water use efficiency to “save” water and then to consume “saved” water to expand irrigated area or to increase irrigation reliability for the same irrigated areas! • 2. For industrial and domestic water uses: • To increase water use efficiency to “save” water , and then to use “saved” water to expand production scales or to water flowers or to create water surfaces for recreation! • 3. For water pollution discharge control: • The pollution discharge permit is disconnected with the environment carrying capacity, which requires the minimum environment flows to meet requirement of water function zones!
Increased water use efficiencies by canal linings Part A / 6-3
Created water surface for recreation ! Part A / 6-3
Outcomes of Traditional Approach • The statistics show that the over-exploitation of groundwater has reached up to 22 billion cubic meters, and over-use of surface water has made rivers and lakes drying up. As a result, the ecosystem in these areas, particularly in northern part of China, has seriously degraded, although the approach contributed to rapid economic development; • The increased water use efficiencies without restrictive conditions have substantially reduced return flows to the rivers, and lowered the groundwater table, which in turn decreased environment carrying capacity of the rivers and lakes, and finally damaged ecosystems; • This happens particularly in the river basins around the Bohai Sea. The reduced fresh flows in local river systems greatly reduced fresh outflows to the Bohai Sea, which has been damaging its offshore ecosystems together with the increasing large amount of pollution discharges to the Sea.
To address water scarcity and pollution issues • New Approach • Targets-based Integrated Water and Environment Management (target ET and target EC) • Guiding Principles: • The Bank would support Integrated Water Resources • Management (IWRM) at the river basin level, and • further down to the administrative and water-user • levels to address various water issues, particularly to • facilitate a shift from current resources-intensive • development patterns to more resources-efficient • development patterns.
Two Major Types of Water Scarcity in China • Economic water scarcity area - where there are relatively abundant water resources and water scarcity occurs when there is a lack of investment in water infrastructure or a lack of human, institutional or financial capacity to satisfy demand; and • Physical water scarcity area - where surface and groundwater resources have already been overused and water scarcity occurs when there are insufficient water resources available to meet all water demands.
Strategies for Sustainability • Strategy for economic water scarcity - to increase irrigation efficiency and expand irrigated areas for higher agricultural production, with strengthened agricultural measures; • Strategy for physical water scarcity - to increase water productivity for higher agricultural value per unit of evapotranspiration (ET) with integrated measures, meanwhile reducing actual ET to be less than target ET and actual pollution discharges to be lower than target EC; • Difference of strategies - the former is to consume more water for higher yield; the latter is to consume less water for higher productivity.
Keys of the Strategy in Physical Scarcity Areas • The only water truly lost in a hydrologic system is through Evapotranspiration or ET, which is water evaporated from water surface or transpired from plant leaves into the atmosphere; • Increase of irrigation efficiency in order to grow more crops over a wider irrigated area or to increase cropping intensity in the same irrigation area would raise the level of ET ! • Increase of water use efficiency should be encouraged under the target ET to ensure that water is released to protect ecosystems; • Given the fixed average amount of water available in the river basin, the higher the target ET, the lower the target EC. So the ET and EC should be determined together .
How can we measure and monitor ET ? • By the Latest Remote Sensing (RS) Technology, which is being developed very fast in China ! • Remote sensing by satellites can now provide ET readings for pixels of 10 by 10 meters with a good accuracy. This tells farmers how much water they can consume without adversely affecting the ecosystems around them.
Water Productivity China’s average water productivity in irrigated areas range from 0.6 to 1.0 kg per cubic meter of consumptive use of water, compared to 1.5 to 2.0 kg in some other countries. Low water productivity has resulted in waste of water in irrigated areas.
There has been potential to increase water productivity in the Hai Basin
Water Productivity is expected to increase (Hai Basin Data) 105 105 mm
How to increase water productivity? • Integration of Measures to Increase Water Productivity • AGRONOMIC MEASURES • deep ploughing • straw and plastic mulching • drought resistant crops and technology • seeds improvements for higher yield or value • Soil fertility improvements • High value cropping pattern adjustment • ENGINEERING MEASURES • Increase of upstream storage capacity • Low-pressure distribution pipes • drip and micro-sprinkler application technology • land levelling • MANAGEMENT MEASURES • Improving irrigation by irrigation scheduling • refining soil moisture control
Case study on Water Conservation Project (2000-2006) with the new approach • The farmers' per capita income increased by 193 percent, while consumptive use of water or ET over the irrigated areas fell by 27 percent; and • Water productivity was increased from 0.85 kg/m3 to 1.20 kg/m3 for wheat and from 1.30 kg/m3 to 2.2 kg/m3 for maize with integration of engineering, agronomic and irrigation management measures.
Case study on Turpan Water Conservation Project (2000-2006) with the new approach • The farmers' per capita income increased by 130 percent, while consumptive use of water or ET over the irrigated areas fell by 10 percent; and • Water productivity was increased substantially.
Water Consumption Balance at Turpan Basin 1. Based on the water balance, the agricultural ET will have to be reduced by 255.66 million m3 by 2025 to reach the sustainable level of water use, which means that the irrigated areas will need to be reduced by 47,127 ha by 2025. 2. However, the area to be reduced could be less if water productivity is increased.
ET Reduction in TongZhou District of Beijing, China Before Project After Project
Zhang-Jia-Wan Township Tongzhou District of Being Before Project After Project
Beauty of natural ecological environment returned! Tarim River, the largest inland river in China
Concluding Remarks • Different strategies should be taken in different water scarcity areas to ensure green growth and sustainability; • In physical water scarcity and pollution areas, Target ET and target EC should be jointly determined to ensure that the actual ET is less than target ET and actual pollution discharge is less than target EC; • In physical water scarcity and pollution areas, the strategy is to increase of water productivity or reduction of consumptive use of water or ET, while increasing farmer incomes; • Remote Sensing technology can be used to monitor the actual ET or water productivity and to identify areas for improvements; and • The case studies for the Bank projects in China showed good outcomes with the proposed new approach in physical water scarcity areas in China.