Download
1 / 1
10 likes | 270 Views
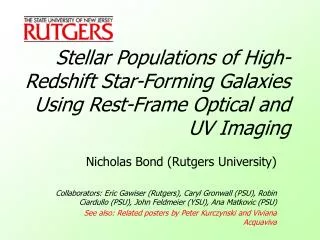
Mingchen Gao Rutgers University minggao@cs.rutgers.edu. Shaoting Zhang Rutgers University shaoting@cs.rutgers.edu. Zhen Qian Piedmont Institute zhen.qian@piedmont.org. Szilard Voros Piedmont Institute sckulp@cs.rutgers.edu. Dimitris Metaxas Rutgers University dnm@cs.rutgers.edu.

E N D
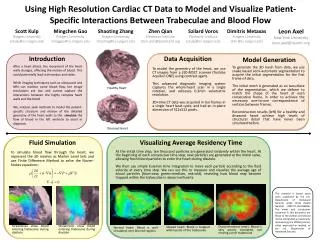
Mingchen Gao Rutgers University minggao@cs.rutgers.edu Shaoting Zhang Rutgers University shaoting@cs.rutgers.edu Zhen Qian Piedmont Institute zhen.qian@piedmont.org Szilard Voros Piedmont Institute sckulp@cs.rutgers.edu Dimitris Metaxas Rutgers University dnm@cs.rutgers.edu Leon Axel New York University leon.axel@nyumc.org Introduction Data Acquisition Model Generation To model the geometry of the heart, we use CT images from a 320-MSCT scanner (Toshiba Aquilion ONE) using contrast agent. This advanced diagnostic imaging system captures the whole-heart scan in a single rotation, and achieves 0.3mm volumetric resolution. 3D+time CT data was acquired in ten frames in a single heart beat cycle, and had an in-plane dimension of 512x512 pixels. After a heart attack, the movement of the heart walls changes, affecting the motion of blood. This could potentially lead to thrombus and stoke. While imaging techniques such as ultrasound and MRI can monitor some blood flow, the image resolutions are low and cannot capture the interactions between the highly complex heart walls and the blood. We, instead, seek methods to model the patient-specific structure and motion of the detailed geometry of the heart walls to the simulate the flow of blood in the left ventricle to assist in diagnosis. To generate the 3D mesh from data, we use snake based semi-automatic segmentation to acquire the initial segmentation for the first frame of data. The initial mesh is generated as an isosurface of the segmentation, which we deform to match the shape of the heart at each consecutive frame, in order to achieve the necessary one-to-one correspondence of vertices between frames. Reconstruction results (left) for a healthy and diseased heart achieve high levels of structural detail that have never been simulated before. Using High Resolution Cardiac CT Data to Model and Visualize Patient-Specific Interactions Between Trabeculae and Blood Flow Healthy Heart Visualizing Average Residency Time Diseased Heart Fluid Simulation Scott Kulp Rutgers University sckulp@cs.rutgers.edu At the initial time step, ten thousand particles are generated randomly within the heart. At the beginning of each consecutive time step, new particles are generated at the mitral valve, allowing fresh blood particles to enter the heart during diastole. We then use simple Eulerian time integration to move each particle according to the fluid velocity at every time step. We can use this to measure and visualize the average age of blood particles (blue=new, green=medium, red=old), revealing how blood may become trapped within the trabeculae in abnormal hearts. To simulate blood flow through the heart, we represent the 3D meshes as Marker Level Sets and use Finite Difference Method to solve the Navier-Stokes equations: This material is based upon work supported by the U.S. Department of Homeland Security under Grant Award Number 2007-ST-104-000006. The views and conclusions contained in this document are those of the authors and should not be interpreted as necessarily representing the official policies, either expressed or implied, of the U.S. Department of Homeland Security. Streamlines show blood entering trabeculae during diastole Streamlines show blood entering trabeculae during diastole Dyssynchronous heart: Blood is very poorly circulated, not moving out of trabeculae Slowed heart: Blood is trapped within parts of the trabeculae Normal heart: Blood is well-circulated, very few red regions.