Download
1 / 45
530 likes | 1.16k Views
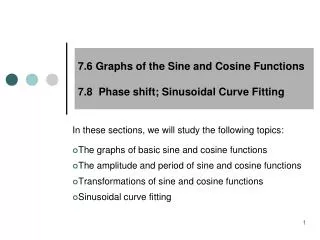
7.6 Graphs of the Sine and Cosine Functions 7.8 Phase shift; Sinusoidal Curve Fitting. In these sections, we will study the following topics: The graphs of basic sine and cosine functions The amplitude and period of sine and cosine functions Transformations of sine and cosine functions

E N D
7.6 Graphs of the Sine and Cosine Functions7.8 Phase shift; Sinusoidal Curve Fitting In these sections, we will study the following topics: The graphs of basic sine and cosine functions The amplitude and period of sine and cosine functions Transformations of sine and cosine functions Sinusoidal curve fitting
The graph of y = sin x The graph of y = sin x is a cyclical curve that takes on values between –1 and 1. Therange of y = sin x is _____________. Each cycle (wave) corresponds to one revolution of the unit circle. The period of y = sin xis _______ or _______. Graphing the sine wave on the x-y axes is like “unwrapping” the values of sine on the unit circle.
Take a look at the graph of y = sin x: (one cycle) Points on the graph of y = sin x
More about the graph of y = sin x Notice that the sine curve issymmetric about the origin. Therefore, we know that the sine function is an ODD function; that is, for every point (x, y) on the graph, the point (-x, -y) is also on the graph. For example, are on the graph of y = sin x.
Using Key Points to Graph the Sine Curve • Once you know the basic shape of the sine curve, you can use the key points to graph the sine curve by hand. • The five key points in each cycle (one period) of the graph are: • 3 x-intercepts • maximum point • minimum point
The graph of y = cos x The graph of y = cos xis also a cyclical curve that takes on values between –1 and 1.The range of the cosine curve is ________________. The period of the cosine curve is _______ or _______.
Take a look at the graph of y = cos x: (one cycle) Points on the graph of y = cos x
More about the graph of y = cos x Notice that the cosine curve issymmetric about the y-axis. Therefore, we know that the cosine function is an EVEN function; that is, for every point (x, y) on the graph, the point (-x, y) is also on the graph. For example, are on the graph of y = cos x.
Using Key Points to Graph the Cosine Curve • Once you know the basic shape of the cosine curve, you can use the key points to graph the cosine curve by hand. • The five key points in each cycle (one period) of the graph are: • maximum point • 2 x-intercepts • minimum point
Characteristics of the Graphs of y = sin x and y = cos x • Domain: ____________ • Range: ____________ • Amplitude: The amplitude of the sine and cosine functions is half the • distance between the maximum and minimum values of the function. • The amplitude of both y= sin x and y = cos x is ______. • Period: The length of the interval needed to complete one cycle. • The period of both y= sin x and y = cos x is ________.
Transformations of the graphs of y = sin x and y = cos x • Reflections over x-axis • Vertical Stretches or Shrinks • Horizontal Stretches or Shrinks/Compression • Vertical Shifts • Phase shifts (Horizontal)
I. Reflection in x-axis Example:
II.Vertical Stretchor Compression (Amplitude change) Example
II. Vertical Stretch or Compression • *Note: • If the curve is vertically stretched • if the curve is vertically shrunk
Example The graph of a function in the form y = A sinx or y = A cosx is shown.Determine the equation of the specific function.
III. Horizontal Stretch or Compression (Period change) Example
III. Horizontal Stretch or Compression (Period change) • *Note: • If the curve is horizontally stretched • If the curve is horizontally shrunk
Graphs of Examples State the amplitude and period for each function. Then graph each of function using your calculator to verify your answers. (Use radian mode and ZOOM 7:ZTrig)
Graphing Sinusoidal Functions Using Key Points We will start with the parent graphs:
y x
V. Vertical Shifts Example
V. Phase Shifts Example
y x EXAMPLE For , determine the amplitude, period, and phaseshift. Then sketch at least once cycle of the function by hand.
EXAMPLE List all of the transformations that the graph of y = sin x has undergone to obtain the graph of the new function. Graph the function by hand.
y x EXAMPLE (CONTINUED)
EXAMPLE List all of the transformations that the graph of y = sin x has undergone to obtain the graph of the new function. Graph the function by hand.
y x EXAMPLE (CONTINUED)
* *NOTE: In 2005, summer solstice was on June 21 (172nd day of the year).
Use a graphing calculator to graph the scatterplot of the data in the table below. Then find the sine function of best fit for the data. Graph this function with the scatterplot.